Monitor Director Nodes and Analytics Node Alarms
![]() For supported software information, click here.
For supported software information, click here.
Versa Director is a centralized single-pane-of-glass platform that you use to monitor all the controllers, branch sites, and hub sites in your network. You can access all monitoring dashboards, screens, and tools in Director view by selecting the Monitor tab.
The Versa Director monitor dashboard displays resource information and the real-time system status of the Director applications and Versa Director nodes, and it provides a detailed information about alarms that have occurred on Versa Director and Versa Analytics nodes.
To view the Director monitor dashboard, in Director View, select the Monitor tab, and then select Director from the Organization drop-down list.

The following sections describe the panes on the Versa Director monitor dashboard:
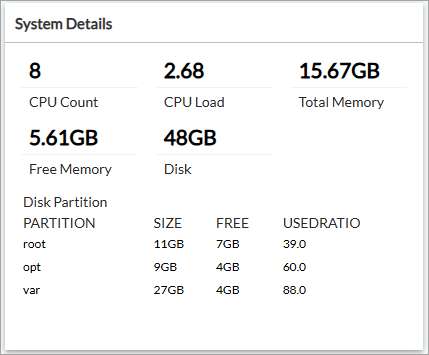
System Details
The System Details pane displays information about Director CPU, memory, and disk resources.
Recent Events
When notable events occur on Director and Analytics nodes, such as exceeding memory usage thresholds, the nodes generate alarms. The Recent Events pane displays alarm counts for Director and Analytics nodes. From the Recent Events pane, you can drill down to display alarm details and manage alarms.
Note: Analytics nodes do not forward alarms to Director by default. To, view Analytics alarms from the Monitor tab, you must configure Analytics nodes to export their alarms. See Export Alarms Logs to Director Nodes in Configure Log Collectors and Log Exporter Rules.
Alarms
To view information about alarms of a given severity level, click the alarm count.

A table of alarms with that severity level displays. The following example displays alarms with severity level Indeterminate for a Director node.

To view alarms for all severity levels, select View Details in the Recent Events pane. The Director Recent Events or Analytics Recent Events table displays.

The Director Recent Events table displays both notification alarms from the Director application and alarms from the Director node. The Analytics Recent Events table displays Analytics device alarms. For more information about Director application alarms and Director node alarms, see Event Notifications and Director Alarms. For more information about Analytics device alarms, see Configure Analytics Alarms.

To view related alarm information for a specific device, click the device name.

To return to the Director monitor dashboard, click the ![]() Back button.
Back button.
Manage Alarms
To clear, export, or handle an alarm, click the checkbox next to the device name. This activates the Recent Events menu in the upper right corner of the screen.

Clear Alarms
To clear an alarm, click the box to the left of one or more alarms, and then click the ![]() Clear Selected Alarm icon. In the Clear Alarm(s) window, click Yes to confirm.
Clear Selected Alarm icon. In the Clear Alarm(s) window, click Yes to confirm.

Export Alarms
To export the alarm details to a CSV file, select the alarms, and then click the ![]() Export icon.
Export icon.
Handle Alarms
To handle and assign an alarm, select the alarm and click the ![]() Handle/Assign icon.
Handle/Assign icon.
In the Alarm Handling window, select the required information and then click OK.

Package Information
The Package Information pane displays information about the Director software image package that is installed and running on the Director node.

High Availability
The High Availability pane displays information about Director high availability (HA) mode.

The fields display the following information:
| Field | Description |
|---|---|
| Failover Timeout | Timeout period, in seconds, before the standby node promotes itself to the active state. |
| Standby Start Timeout | When the service starts, the non-designated active node waits for a period of three times the backup start timeout (in seconds), before the designated master promotes itself to the active state. |
| Auto Switchover Timeout | Wait timeout period, in seconds, before the designated active node promotes itself to the active state. |
| Autoswitchover Enabled | Whether automatic switchover from the backup to the active Director node is enabled (true) or not (false). |
| Master | Whether the Director node is the active node (true) or not (false). |
| Enabled | Whether high availability is enabled (true) or not (false). |
| Node Name | Name of the Director node. |
| Southbound Interface | IP address or addresses of the Director node's southbound interface. |
Uptime
The Uptime pane displays information about how long the Director node has been up and operational.
- Application uptime—How long the Director service process (daemon) has been operational.
- System uptime—How long the Director node has been up since the last reboot.

License
The License pane displays information about the Director node's software license.

Supported Software Information
Releases 20.2 and later support all content described in this article.