Configure Analytics Alarms
For supported software information, click here.
Analytics nodes and clusters generate alarms for notable events. There are two categories of Analytics alarms:
- Analytics device alarms—Device alarms provide real-time status about the log collector exporter (LCE), Versa Analytics driver, and Analytics node resources such as CPU and disk utilization. Each Analytics node generates separate device alarms.
- Analytics cluster alarms—Cluster alarms provide information about cluster-wide resources, such as database and search engine utilization.
You configure and display cluster alarms separately from device alarms.
Analytics Device Alarms
Analytics nodes generate device alarms when device resources exceed the configured thresholds. You can view device alarms from Monitor tab in the Director GUI. You can modify alarms thresholds.
Device Alarm Types
The following table lists the device alarm types for Versa Analytics nodes, and the default destination and severity for each type.
| Alarm Type | Description | Default Destination |
Severity |
|---|---|---|---|
| Remote collector down | Remote collector is down | syslog | Critical |
| Remote collector queue utilization | Remote collector queue utilization has exceeded the default or configured threshold values | syslog | Critical, Major |
| System CPU utilization | System CPU utilization has exceeded the default or configured threshold values | syslog | Critical, Major |
| System disk utilization | System disk utilization has exceeded the default or configured threshold values | syslog | Critical, Major |
| System memory utilization | System memory utilization has exceeded the default or configured threshold values | syslog | Critical, Major |
| Versa Analytics driver stuck | Versa Analytics Driver is not functioning | syslog | Critical |
Configure Device Alarms
Each Analytics node generates alarms when resources, such as CPU usage, exceed their usage thresholds. Analytics device alarms are enabled for all resources by default. You can modify the resource thresholds that trigger the alarms, and you can disable alarms for individual resources.
To modify Analytics device alarm thresholds and disable or enable device alarms:
- In Director view, select the Analytics tab in the top menu bar.
- Select Administration > Configurations > Log Collector Exporter in the left menu bar.
- In the Driver Hosts field, select the Analytics node.
- Select System > Alarm Settings.

- Click +Add Alarms Settings. The Add Alarm Settings popup window displays.

- Enter information for the following fields.
Field Description Alarm Type Select an alarm type:
- CPU Utilization—Versa Analytics system CPU utilization threshold alarm.
- Disk Utilization—Versa Analytics system disk utilization threshold alarm.
- Versa Analytics Driver Stuck—Alarm generated when the Versa Analytics driver is stuck in a non-functional state.
- Memory Utilization—Versa Analytics system memory utilization threshold alarm.
- Remote Collector Down—Remote collector down alarm.
- Remote Collector Queue Utilization—Remote collector queue utilization threshold alarm.
Soak Time Waiting period before alarm is reported, in seconds. Severity (For alarm types Versa Analytics Driver Stuck and Remote Collector Down only.)
Select the severity for the alarm.
Low Threshold (For all alarm types except Versa Analytics Driver Stuck and Remote Collector Down.)
Enter the low threshold for the resource listed in the alarm type field. When the resource exceeds this threshold, the Analytics node generates an alarm. You select the severity assigned to this alarm in the Override Low-Threshold Alarm Severity field, below.High Threshold (For all alarm types except Versa Analytics Driver Stuck and Remote Collector Down.)
Enter the high threshold for the resource listed in the alarm type field. When the resource exceeds this threshold, the Analytics node generates an alarm. You select the severity assigned to this alarm in the Override High-Threshold Alarm Severity field, below. When resource usage returns to a level below this threshold, the node generates a severity Cleared alarm.Override Low-Threshold Alarm Severity (For all alarm types except Versa Analytics Driver Stuck and Remote Collector Down.)
Select the alarm severity level for low-threshold alarms.Override High-Threshold Alarm Severity (For all alarm types except Versa Analytics Driver Stuck and Remote Collector Down.)
Select the alarm severity level for high-threshold alarms.Disable Disable the alarm. - Click Save.
View Device Alarms
You can view Analytics device alarms from the Monitor tab in the Director GUI. To do this, you must configure Analytics nodes to stream device alarm logs to Director nodes. For information, see Export Alarm Logs to Director Nodes in Configure Log Collectors and Log Exporter Rules.
To view Analytics device alarms in Director view, select the Monitor tab. Then, in the Organization drop-down list, select Director. The Analytics section in the Recent Events pane displays a count of Analytics device alarms by severity level.

In the Analytics section, select View Details to view a table of device alarms.

Stream Device Alarms to Third-Party Remote Collectors
You can stream Analytics device alarms to third-part remote collectors. In typical configurations, you create an exporter rule to export alarm logs of all types, including alarms from branch and controller devices, to third-party remote collectors. In this case, Analytics device alarms are included, and no further configuration is required.
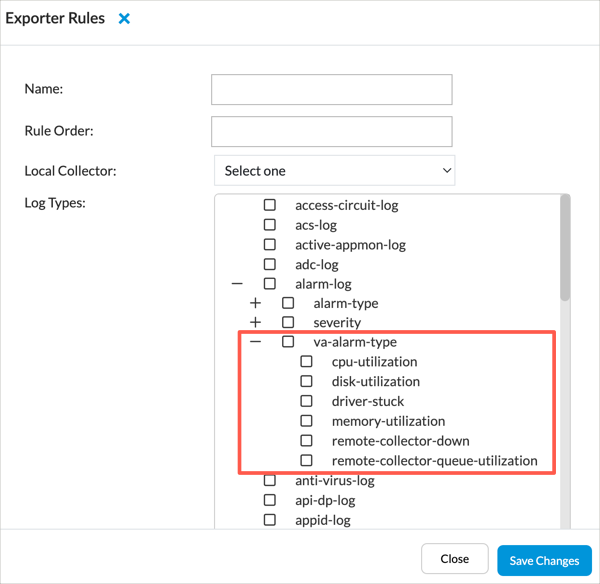
To create a separate exporter rule to stream only Analytics device alarms to a third-party collector:
- To export all Analytics device logs, select log type va-alarm-type.
- To export individual alarm subtypes, select the subtypes from the list under va-alarm-type.
For more information about exporting logs from Analytics nodes, see Configure Log Collectors and Log Exporter Rules.
Note: For Analytics nodes with no configured local collectors, you must configure a dummy local collector and exporter rules along with the remote collector in order to stream Analytics device alarms to third-party collectors.
Analytics Cluster Alarms
For Releases 21.1.3 and later.
Analytics clusters generate cluster alarms when cluster resources exceed the configured thresholds. You can view cluster alarms from the Analytics tab in the Director GUI. You can modify thresholds and receive email notifications when cluster resources exceed configured thresholds.
Configure Cluster Alarms
To modify cluster resource thresholds and to enable email notifications for alarms:
- In Director view, select the Analytics tab.
- Select Administration > Configuration > Settings.
- In the main pane, select the System Monitoring tab. Enter information for the following fields.

Field Description Enable Monitoring on this Machine Toggle On to enable monitoring of the listed thresholds. Toggle Off to disable. Email Notifications Toggle On to send email notifications when thresholds are exceeded. Toggle Off to disable. Search Disk Usage Threshold Enter a threshold value for disk usage on search-type Analytics nodes as a percentage of disk. Search Memory Usage Threshold Enter a threshold value for memory usage on search-type Analytics nodes as a percentage of memory. Analytics Disk Usage Threshold Enter a threshold value for disk usage on analytics-type Analytics nodes as a percentage of disk. Analytics Memory Usage Threshold Enter a threshold value for memory usage on analytics-type Analytics nodes as a percentage of memory. Search Logs Threshold Enter a threshold value for the number of search logs, in kilobytes. - Click Save.
- (Optional) If you enabled Email Notifications in Step 3, perform the following steps to configure email settings.
- Select Administration > Configuration > Settings in the left menu bar. The Settings screen displays.

- Select the Email Configuration tab, and then enter information for the following fields.
Field Description SMTP Host Enter the name of the Simple Mail Transfer Protocol (SMTP) host. SMTP Port Enter the port number to use to connect to the SMTP host. Username Enter the username to use to connect to the SMTP server. Password Enter the password to use to connect to the SMTP server. SSL Click to use SSL encryption. TLS Click to use TLS encryption. Sender Email Enter the email address to place in the From: field of the email. System Email Notifications Enter the email address to which to send Analytics monitoring notifications. To enter more than one email address, separate them with commas. - Click Save Configuration.
- Select Administration > Configuration > Settings in the left menu bar. The Settings screen displays.
View Cluster Alarms
To view Analytics cluster alarms:
- In Director view, select the Analytics tab in the top menu bar.
- Select Administration > Configuration > Settings in the left menu bar.

- In the main pane, select the System Monitoring tab. The Alarms table displays.

Supported Software Information
Releases 21.2.1 and later support all content described in this article except:
- Releases 21.3.1 and later support Analytics cluster alarms.