Configure Log Collectors and Log Exporter Rules
![]() For supported software information, click here.
For supported software information, click here.
When you initially configure an Analytics cluster, you configure one or more Analytics nodes to collect logs. These nodes are called Analytics log collector nodes, and they collect log messages (simply called logs), which include alarms, from all the Versa Operating SystemTM (VOSTM) and Controller devices in the network, in IPFIX format. Analytics log collector nodes run two programs to accept and process the incoming logs: the log collector exporter (LCE) and the Versa Analytics driver. The log collector exporter listens for incoming connections that contain logs, called log export functionality (LEF) connections, and stores the logs on the Analytics node on which it is running. The Analytics driver on that node then processes the logs into the Analytics datastores in the Analytics cluster. For an overview of Analytics configuration concepts, including Analytics clusters, Analytics datastores, the Analytics driver, and LEF connections, see Versa Analytics Configuration Concepts.
To have the log collector exporter stream incoming logs to an external third-party collector, you can configure a remote collector. A remote collector streams the logs to one or more third-party collectors in syslog format using an SSL, a TCP, or a UDP transport. For Releases 21.1.1 and later, a remote collector can stream logs to a Kafka remote log collector cluster. For critical security events, you can configure an Analytics log collector node to send email alerts and notifications to users.
This article describes how to configure the components of the log collector exporter to do the following:
- Accept incoming logs.
- Stream logs to a remote system.
- Store logs to be archived without processing.
- Store logs to be processed into Analytics cluster datastores.
- Forward logs to Versa Director nodes.
This article also describes how to configure an Analytics node to send email alerts and user notifications.
Log Collector Exporter
Analytics log collector nodes run a copy (instance) of the log collector exporter. You configure the log collector exporter to listen for incoming LEF connections by adding a local collector. A local collector listens at a TCP port on a network interface for incoming logs and then stores the logs in a local directory, usually /var/tmp/log. You can configure a local collector to store flow (session) logs in a separate directory than other log types.
The log collector exporter can also forward logs from a local collector to a remote system. To configure this function, you create a remote collector for the remote system, and you then associate the local collector to one or more remote collectors using log exporter policy rules. These rules specify which types of logs to stream to the remote collectors.
For high availability (HA), you can stream to a set of remote collectors, called a remote collector group. In this case, the log collector exporter streams logs to the first reachable member of the group, called the active collector. For redundancy, you can place a set of remote collector groups in a remote collector group list. In this case, the log collector exporter streams logs to the active collector in each remote collector group in the list.
For more information about the log collector exporter, see Log Collector Exporter in Analytics Configuration Concepts.
Local collectors, remote collectors, remote collector groups, remote collector group lists, and log exporter policy rules are all components of the log collector exporter.
Versa Analytics Driver
The logs that are copied to the log storage directory, /var/tmp/log, on an Analytics log collector node are processed by the Versa Analytics driver on that node. Local collectors copy logs to /var/tmp/log, and you can also issue log archive restoration commands to copy logs to this directory. The Analytics driver reads the log files in /var/tmp/log, formats the raw logs, and sends them to the non-SQL (NoSQL) database and search engine datastore. This is referred to as ingesting the logs. After the Versa Analytics driver processes a log, it moves the log to a backup subdirectory. A cron job periodically archives the logs in the backup directories, once an hour by default. For more information about log archival, see Manage Versa Analytics Log Archives.
The Versa Analytics driver processes only log files in the /var/tmp/log directory. If you configure a local collector to store logs in a different directory, the Versa Analytics driver does not process the logs. Storing logs in a different directory can be useful when you are required to collect logs but do not need log analysis.
For Releases 22.1.4 and later, you can modify settings for the driver; see Modify Versa Analytics Driver Settings.
Driver Hosts
A driver host is any Analytics node that collects logs. For these nodes, you can configure and view information about the following services:
- Log collector exporter instance
- Analytics driver instance
- Log archival for the node
You must configure these services independently for each driver host. All GUI screens that access these services provide a Driver Hosts drop-down list where you can select the driver host.
Note: For Releases 23.1.1 and later, you can configure a single driver host and then clone the configuration to other driver hosts. The cloning feature copies the currently selected driver host's log collector exporter configuration to another driver host. See Clone a Log Collector Exporter Template, below.
For Releases 22.1.1 and later, the following example screenshot displays the local collectors for an instance of the log collector exporter. To display this screen, select Analytics > Administration > Configurations > Log Collector Exporter > Local Collector.
- In the horizontal menu bar that is below the top menu bar, Corp-Inline-Cluster-1-Analytics2 indicates that the Director node is using node Analytics2 in the Analytics connector Corp-Inline-Cluster-1 to access the Analytics information and to interact with the nodes in the cluster. Here, Analytics2 is the name of the northbound node at IP address 10.40.24.141 for the connector. You can use any node that resides in an Analytics cluster to communicate with the cluster.
- In the Driver Hosts field, the IP address 192.168.1.121 indicates that the current screen applies to the instance of the log collector exporter at 192.168.1.121. Here, 192.168.1.121 is the southbound IP address of the Analytics node at 10.40.24.141. The Local Collector tab is selected, so you can add, modify, and delete local collectors for the instance on 192.168.1.21 from this screen.

For Releases 21.2 and earlier, the following example screenshot displays the local collectors for an instance of the log collector exporter. To display this screen, select Analytics > Administration > Configurations > Log Collector Exporter > Local Collector.
- The horizontal menu bars shows Analytics-10.48.189.23, which indicates that the Director node is using the Analytics node at IP address 10.48.189.23 to access the Analytics information and to interact with the nodes in the cluster. Here, Analytics is the name for the Director connector to the cluster, and 10.48.189.23 is the IP address assigned to the node in the northbound IP table for the connector. You can use any node that resides in an Analytics cluster to communicate with the cluster. For information about configuring a connector, see Configure an Analytics Connector in Perform Initial Software Configuration.
- In the Driver Hosts field, the value localhost indicates that the current screen applies to the instance of the log collector exporter that is running on the local system, whose IP address 10.48.189.23. The Local Collector tab is selected, so you can add, modify, and delete local collectors for the log collector exporter on 10.48.189.23 from this screen.

Set Up a Local Collector
You configure local collectors on Analytics nodes to receive logs from Versa Controller nodes. If your Analytics cluster topology contains log forwarder nodes, you configure local collectors on these nodes, and they forward log information to the database and search engine running on analytics-type and search-type nodes in the cluster. If your topology does not contain log forwarder nodes, then you configure local collectors on the cluster's search-type and analytics-type nodes.
For each node that collects logs, you configure a single local collector during initial software configuration. To do this, you specify a collector address and collector port for the Analytics node in the clustersetup.conf file on the primary Director node. Then, you run the van_cluster_installer.py script from Director, which prompts the Analytics nodes to configure local collectors. For information about configuring an Analytics cluster, see Set Up Analytics in Perform Initial Software Configuration.
You can add local collectors and modify settings for an existing local collector for an Analytics log collector node. See Modify or Add a Local Collector, below.
Local collectors receive logs from ADC services configured on Versa Controllers. An ADC service is associated with a set of ADC servers, one for each Analytics node that receives logs. However, ADC servers do not automatically track if their associated Analytics node is responsive. To perform this function, you attach an ADC monitor to the ADC server.
Both the ADC server and the ADC monitor must form TCP connections with a local collector on their associated Analytics node. A TCP connection is formed for each log stream received by the ADC service. If your topology contains multiple tenant organizations and many branches, then a large number of connections may be required.
With the added volume of TCP connections from ADC monitors, local collectors can exceed their connection limit. To avoid exceeding the limit, you can figure a dummy local collector that is used only by the ADC monitor. The dummy collector does not receive logs; instead, the ADC monitor probes the collector's TCP port to determine if the log collector node is responsive. When configuring the ADC monitor, the IP address of the dummy collector is called the alias address, and the port number is called the alias port number. For information about configuring ADC servers and ADC monitors, see Configure an Application Delivery Controller.
In the following example, Log Collector Node 1 has a local collector at 192.45.13.1, port 1234 that receives logs from ADC Server 1. A dummy local collector is configured at 192.45.13.1, port 1235, and ADC Monitor 1 uses this port to form temporary TCP connections to probe the health of Log Collector Node 1. ADC Monitor 1 is configured with alias address 192.45.13.1 and alias port number 1235. Log Collector Node 2 and ADC Monitor 2 are configured in a similar manner.

Note: For Releases 21.1.4 and earlier, local collectors process IPFIX logs only if they are received with a template version less than or equal to its known value. For Releases 21.2.1 and later, local collectors can accept logs from VOS devices running newer versions of the IPFIX template.
By default, for Releases 21.2.1 and later, new log types sent by branches are dropped and log types recognized by Analytics nodes are accepted and parsed. You can change the default behavior from the CLI. If you disable the default values, all logs with a higher IPFIX template version are dropped. To disable the default values:
admin@Analytics% show log-collector-exporter settings template
backward-compatible-only false;
Set Up Remote Log Export
To configure the log collector exporter to stream logs to a remote system, you configure the following:
- Remote template—Configure the export format used by the remote collector.
- Remote collector—Configure the IP address and port of the remote system to which logs are sent.
- Remote collector group—Optionally, configure a set of remote collectors.
- Remote collector group list—Optionally, configure a list of remote collector groups.
- Remote profile—Configure a name for a remote collector, remote collector group, or remote collector group list.
- Exporter rules—Configure rules to associate a local collector with a remote profile and to define the types of logs to stream from the local collector to the remote collectors in the remote profile. A log exporter policy rule associates one local collector with one remote profile.
The following sections describe how to configure each of these items.
Configure a Remote Template
You configure a remote template to define the general types of logs that a remote collector exports and to configure the format of the logs.
To configure a remote log collector template:
- In Director view, select the Analytics tab in the top menu bar.
- Select an Analytics cluster node:
- For Releases 22.1.1 and later, hover over the Analytics tab and then select an Analytics node.
- For Releases 21.2 and earlier, select an Analytics node in the horizontal menu bar.
- Select Administration > Configurations > Log Collector Exporter in the left menu bar.
- Select the Remote Template tab. The following screen displays.

- In the Driver Hosts field, select the Analytics log collector node.
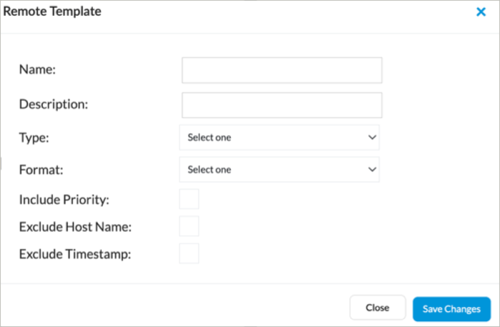
- Click the
 Add icon. The Remote Template popup window displays. Enter information for the following fields.
Field Description Name Enter a name for the remote collector template. Description Enter a text description for the remote collector template. Type Select the type of logs to send to the remote collector:
- Syslog
Format Select the format in which to send the logs to the remote collector. When exporting to a Director node, use KVP format. Note that many third-party collectors accept only KVP format.
- CEF—Common event format
- CSV—Comma-separated values
- KVP—Key–value pair data
Default: KVP
Include Priority Click to include priorities. Note that you should not enable Include Priority if you select KVP as the format. Exclude Host Name Click to exclude the host name from logs. Exclude Timestamp Click to exclude the timestamp from logs. - Click Save.
Configure a Remote Collector
To configure a remote collector, you define the destination IP address of the remote server and information about the connection to the remote server. Analytics log collector nodes stream logs to remote destinations using TCP and UDP as the underlying connection mechanisms. For Releases 21.1 and later, you can stream logs securely over a Transport Layer Security (TLS) connection. For TLS connections, the certificates must be in Privacy Enhanced Mail (PEM) format, and you cannot use certificate chains for certificate verification.
For Releases 22.1.4 (Service Release dated 2024-12-20) and later, you can configure a remote collector for use in streaming logs to a Kafka cluster using the procedure in this section. For Releases 21.2.3 and earlier, you must configure this type of remote collector from the CLI. See Configure a Kafka Remote Log Collector, below.
To stream logs and alarms to a Director node, you configure a remote collector with the destination port TCP 20514 and the destination address of the Director node. For more information, see Export Alarm Logs to Director Nodes.
To configure a remote collector:
- In Director view, select the Analytics tab in the top menu bar.
- Select Administration > Configurations > Log Collector Exporter in the left menu bar.
- Click the Remote Collector tab. The following screen displays.

- In the Driver Hosts field, select the Analytics log collector node .
- Click the Add icon. The Remote Collector popup window displays. Enter information for the following fields.
Field Description Name (Required) Enter a name for the remote collector. Description Enter a text description for the remote collector. Destination Address Enter the destination IP address of the remote system. Destination Port Enter the port number to use to connect to the remote system. To stream logs and alarms to a Director node, configure TCP port 20514. Destination FQDN (For Releases 21.1.1 and later.) Enter the fully qualified domain name (FQDN) of the destination system. To use FQDN, the DNS server listed in the /etc/resolv.conf file must be reachable from the log collector to perform the name resolution. Alternately, add the hostname and IP address to the /etc/hosts file. Pending Queue Limit Enter the maximum number of log messages that can be queued for sending to the remote collector.
Default: 2048Source Address Enter the IP address of the Analytics log collector node. This is the address of the southbound interface on the Analytics node. Transmit Rate Enter the maximum rate at which to transmit log messages to the remote collector.
Default: 1000 per secondType Select the transport type to use on the connection between the Analytics log collector node and the remote system:
- TCP
- TLS—(For Releases 21.1.1 and later.) Stream the logs securely.
- UDP
TLS Attributes (Group of Fields)
If you select TLS for the Type field, enter information for the following fields:
- CA Certificate Path—Enter the path to the CA certificate.
- Private Key Path—Enter the path to the private key.
- Client Certificate Path—Enter the path to the client certificate.

Note:
- The private key file must not be passphrase protected
- ]For Releases 22.1.4 (Service Release dated 2025-06-27) and later, Versa Analytics supports both one-way and mutual TLS (mTLS) for remote collectors.
- To enable Mutual TLS, enter values for CA Certificate Path, Private Key Path, and Client Certificate Path fields.
- To enable one-way TLS, leave the Private Key Path and Client Certificate Path fields empty. The CA Certificate Path field is optional. If you do not enter a value for this field, the system CA bundle is used.
- For Releases prior to Release 22.1.4 (Service Release dated 2025-06-27), the Client Certificate Path and Private Key Path fields are required. If the CA Certificate Path field is empty, the system CA certificate bundle is used. The private key file must not be passphrase protected.
Template Select the remote collector template to apply. For more information, see Configure a Remote Template, above. Add Kafka Configuration (For Release 22.1.4 (Service Release dated 2024-12-20) and later.) Click to display Kafka configuration fields.
- Kafka Configuration (Group of Fields)
- Name of the Topic
Enter the default Kafka topic. - Brokers
Enter a comma-separated listed of Kafka brokers. - Message Max Retries
Enter the maximum number of retries. - Health Monitoring Configuration (Group of Fields)
- Eval Interval
Enter the evaluation interval, in seconds, after which errors are reset.
Range: 60 to 300
- Clear Interval
Enter the clear interval, in seconds, after which the connection health state is cleared.
Range: 60 to 3600
- Error Threshold
Enter the error threshold. If the number of errors exceeds this threshold in the last evaluation interval, the connection health state is set to “conn-err-exceeds-threshold“ and a switchover is triggered.
Range: 1 to 10000000
- Topic Mapping Configuration (Group of Fields)
Build a list of specifications for Kafka topics. These are the allowable topics for the
Topic Flag field when you add an exporter rule in Configure Log Exporter Rules, below.
- Topic
Enter a Kafka topic name. - Unique Value of the Flag
Enter a flag number for the topic.
Range: 0 to 7
- Required Number of Acknowledgement
Enter one of the following values:
- 0—No acknowledgement
- 1—Only the leader broker acknowledges
- -1—The broker blocks until one of the following occurs:
- The message is committed by all in-sync replicas (ISRs)
- The minimum number of in-sync replicas is met. This value is configured in the broker's min.insync.replicas property.
- Request Timeout
Enter a timeout value for the request, in milliseconds. - Local Message Timeout
Enter a local message timeout value, in milliseconds.
Range: 0 to 900000
- Add
Click to add a new entry to the Topic Mapping Configuration table. - Cancel
Click Cancel to clear the Topic Mapping Configuration group of fields. The items previously added to the Topic Mapping Configuration table are not affected. - Click Save Changes.
Configure a Remote Collector Group
To provide HA for remote collectors, you can configure multiple remote collectors, as described in the previous section, and then place them into a remote collector group. You can configure one of the remote collectors to be the primary collector. The logs are streamed to the primary collector when it becomes active. When the connection to the active collector is unavailable, logs are streamed to next collector in the group. Logs continue to stream to this collector even if the initial active collector again becomes available.
To configure a remote collector group:
- In Director view, select the Analytics tab in the top menu bar.
- Select an Analytics cluster node:
- For Releases 22.1.1 and later, hover over the Analytics tab and then select an Analytics node.
- For Releases 21.2 and earlier, select an Analytics node in the horizontal menu bar.
- Select Administration > Configurations > Log Collector Exporter in the left menu bar.
- Select the Remote Collector Group tab. The following screen displays.

- In the Driver Hosts field, select the Analytics log collector node.
- Click the Add icon. The Remote Collector Group popup window displays. Enter information for the following fields.

Field Description Name Enter a name for the remote collector group. Description Enter a text description for the remote collector group. Collectors Highlight the remote collectors to include in the group by clicking on the remote collector name. Control-click to select or deselect individual remote collectors.
Primary Collector Select a primary remote collector. - Click OK.
Configure a Remote Collector Group List
To provide redundancy, you use a remote collector group list to export logs to multiple remote systems. To do this, you place two or more remote collector groups into a list, and then logs are streamed to the active collector of each remote collector group. You define the list on the same screen on which you define a remote profile. See Configure a Remote Profile, below.
Configure a Remote Profile
You configure a remote profile to assign a name to an individual remote collector, a remote collector group, or a remote collector group list. You then reference the remote profile when you configure a log exporter policy.
To configure a remote profile:
- In Director view, select the Analytics tab in the top menu bar.
- Select an Analytics cluster node:
- For Releases 22.1.1 and later, hover over the Analytics tab and then select an Analytics node.
- For Releases 21.2 and earlier, select an Analytics node in the horizontal menu bar.
- Select Administration > Configurations > Log Collector Exporter in the left menu bar.
- Select the Remote Profile tab. The following screen displays.

- In the Driver Hosts field, select the Analytics log collector node.
- Click the Add icon. The Remote Profile popup window displays. Enter information for the following fields.

Field Description Name (Required) Enter a name for the remote profile. Description Enter a text description for the remote profile. Collector Fields (Required) Choose one of the collector fields.
- Collector
Click, and then select the name of a remote collector.
- Collector Group
Click, and then select the name of a remote collector group. - Collector Group List
Click to associate the remote profile with a remote collector group list. Then, control-click individual remote collector groups to add them to the list. - Click Save Changes.
Configure Log Exporter Rules
To define the specific type of logs to stream from a local collector to a remote collector, you configure log exporter rules that match log types and tenants and export them to the remote collector defined in a remote profile. When you define the rules, ensure that the match criteria are unique in the local collector. If you configure overlapping match criteria, the rule that matches first is used first and the other rules are ignored.
To configure log exporter rules:
- In Director view, select the Analytics tab in the top menu bar.
- Select an Analytics cluster node:
- For Releases 22.1.1 and later, hover over the Analytics tab and then select an Analytics node.
- For Releases 21.2 and earlier, select an Analytics node in the horizontal menu bar.
- Select Administration > Configurations > Log Collector Exporter in the left menu bar.
- Select the Exporter Rules tab. The following screen displays.

- In the Driver Hosts field, select the Analytics log collector node.
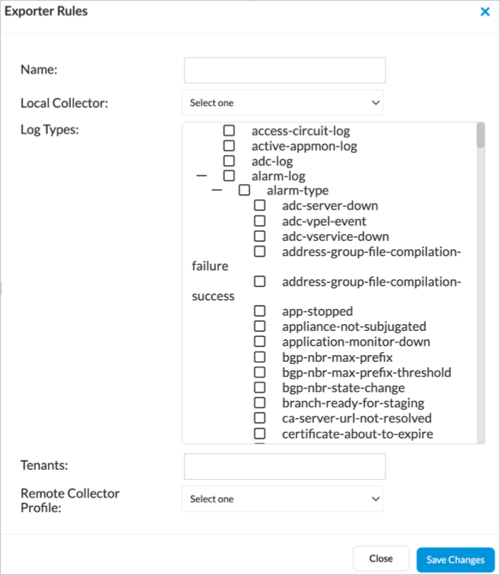
- Click the Add icon. The Exporter Rules popup window displays. Enter information for the following fields.

Field Description Name (Required) Enter a name for the log exporter rule. Rule Order (For Releases 22.1.4 (Service Release dated 2024-12-20) and later.) Enter a rule order (priority) for this rule (1-highest, 64-lowest).
Local Collector (Required) Select a local. The exporter rule inspects the logs received from this local collector. Any logs that match the log types in the Log Types field are exported to the active collectors associated with the remote collector profile selected in the Remote Collector Profile field. Log Types
Select one or more log types to export. If you do not select any log types, all the listed log types are exported. For a description of the log types, see Analytics Log Collector Log Types Overview. Tenants
Enter the names of one or more tenants to export logs only for those tenants. Separate the tenant names with commas. If you do not enter any tenant names, logs for all tenants are exported. Appliances (For Releases 22.1.4 (Service Release dated 2024-12-20) and later.) Enter the VOS device or devices that originated the logs. Remote Collector Profile
Select the name of the remote profile you configured, as described in Configure a Remote Profile, above. The remote profile specifies the remote collector, remote collector group, or remote collector group list that receives the exported logs.
Topic Flag (For Releases 22.1.4 (Service Release dated 2024-12-20) and later.) Enter a Kafka topic flag number. You configure this number when you configure a remote collector in Configure a Remote Collector, above. The topic flag must be configured in a remote collector associated with the remote collector profile. - Click Save Changes.
For Releases 22.1.1 and later, you can configure export rules to match alarm logs based on the alarm text. You can match up to four alarm text strings in match criteria per exporter rule. Issue the following CLI command on the Analytics node running the log collector exporter:
admin@Analytics% set log-collector-exporter exporter rules alarm-rule match features alarm-log alarm-text list
Clone a Log Collector Exporter Template
For Releases 23.1.1 and later.
You can clone a log collector exporter template in Versa Analytics. In most deployments, the log forwarders have the same configuration for local collectors, remote collectors, and exporter rules. Instead of individually modifying the configuration on each log forwarder, you can clone the template from one log forwarder to one or more log forwarders. The variable field is the local collector server IP address which is accepted per node before merging the configuration.
A log collector exporter template for a driver host consists of all the components listed on the tabs shown under Analytics > Administration > Configurations > Log Collector Exporter:

- System settings
- Local collectors
- Remote templates
- Remote collectors
- Remote collector groups
- Remote profiles
- Exporter rules
To clone a log collector exporter template:
- Select Analytics > Configuration > Settings > Main Settings. The following screen displays.

- In the Driver Hosts field, verify that IP addresses for the following systems are listed:
- The log forwarder node containing the configured log collector exporter template. This is the template that you clone for the other nodes.
- The log forwarder node or nodes that receive the cloned template.
- Select Analytics > Configuration > Log Collector Exporter. The following screen displays.
- In the Driver Hosts field, select the node containing the configuration that you want to clone.

- Click Clone Template. The Select Host popup window displays.
- Click the checkbox to select the node or nodes to which you want to copy the current log collector exporter template.
- Click Next. The Merge Configurations popup window displays.
- In the Address field for each driver host, enter the local collector IP address for the host.
- Click Next.
Export Alarm Logs to Director Nodes
When you select the Monitor tab in the Director GUI, you can view Analytics alarm information in the Recent Events pane. To populate this pane, you must manually configure the log collector exporter to stream alarm logs to TCP port 20514 on Director nodes. This section describes how to configure the log collector exporter to export alarm logs to a single Director node and to an HA Director pair.
If you are exporting alarms to an HA Director pair, note that the log collector exporter cannot distinguish between the active and standby Director nodes; you must stream alarm logs to both Director nodes using a remote collector group list. Both Director nodes listen for alarm logs on TCP port 20514, but the standby automatically discards the logs. The standby instead receives its alarm logs from the active Director node, which continuously synchronizes the logs to the standby. When the standby changes state to active, it then has an up-to-date copy of the alarm logs and automatically begins accepting new logs from TCP port 20514.
To export alarms to a single Director headend node, you configure the following:
- One remote collector that streams logs to TCP port 20514 on the Director node.
- One remote collector group for the remote collector.
- A remote profile that includes the remote collector group.
- An exporter rule that forwards the alarms logs from a local collector to the remote profile. You must configure a separate rule for each local collector.
To export alarms to an HA Director pair, you configure the following:
- Two remote collectors, one for TCP port 20514 on each Director node.
- Two remote collector groups, one for each of the two remote collectors.
- A remote profile that includes a remote collector group list containing the two remote collector groups.
- An exporter rule that forwards the alarm logs from a local collector to the remote profile. You must configure a separate rule for each local collector.
To configure an exporter rule to export alarms to Director nodes:
- In Director view, select an Analytics cluster node:
- For Releases 22.1.1 and later, hover over the Analytics tab and then select an Analytics node.
- For Releases 21.2 and earlier, select an Analytics node in the horizontal menu bar.
Note that the selected node is used to contact the Analytics application. You select the specific node for exporting alarms in Step 3.
- Select Administration > Configurations > Log Collector Exporter in the left menu bar. The following screen displays.

- In the Driver Hosts field, select a node.
- Select the Remote Template tab, and then click the + Add icon. Enter information for the following fields.
Field Description Name Enter a name for the template. Description Enter a description for the template. Type Select Syslog. Format Select KVP. This is the default. Note that when you set the format to KVP, you should not set the Include Priority field.
- Click Save Changes.
- Select the Remote Collector tab, and then click the + Add icon. Enter information for the following fields.
Field Description Name Enter a name for the remote collector. Description Enter a description for the remote collector. Destination Address Enter the IP address of the Director node. Destination Port Enter 20514. Type Select TCP. Template Select the template that you configured in Step 4.
- Click Save Changes.
- If you are configuring an exporter rule for an HA Director pair, repeat Steps 5 and 6 for the second Director node.
- Select the Remote Collector Groups tab, and then click the + Add icon. Enter information for the following fields.

Field Description Name Enter a name for the remote collector group. Description Enter a description for the remote collector group. Collectors Select the remote collector that you configured in Step 5. - Click Save Changes.
- If you are configuring an exporter rule for an HA Director pair, repeat Steps 8 and 9 for the second Director node. In the Collectors field, select the remote collector you configured in Step 7.
- Select the Remote Profile tab, and then click the + Add icon. Enter information for the following fields.

Field Description Name Enter a name for the remote profile. Description Enter a description for the remote profile. Collector Group (For single-Director headend configurations.) Click Collector Group, and then click the remote collector group that you configured in Step 8. Collector Group List (For HA Director headend configurations.) Click Collector Group List, and then shift-click the remote collector groups that you configured in Steps 8 and 10.
- Click Save Changes.
- Select the Exporter Rule tab, and then click the + Add icon. In the Exporter Rules popup window, enter information for the following fields.
Field Description Name Enter a name for the rule. Local Collector Select the local collector. Log Types Click alarm-log. Remote Collector Profile Select the remote collector profile that you configured in Step 11. - Click Save Changes.
- Repeat Steps 3 through 14 for each Analytics node that performs log collection.
- To view Analytics alarms information, select the Monitor tab and then select Director from the Organization drop-down list. Alarm information displays in the Recent Events pane.

Stream Logs to a Kafka Log Collector
For Releases 21.2.3 and earlier.
You can stream logs from an Analytics log collector node to a Kafka cluster. To do this, you configure the Kafka cluster as a remote collector. Logs are streamed in structured syslog format. Note that for Releases 22.1.1 and later, you can select Kafka parameters when you configure a remote collector; see Configure a Remote Collector, above.
Apache Kafka is a distributed publish–subscribe messaging system and a robust queue that can handle a high volume of data and enables you to pass messages from one endpoint to another. You can use Kafka across an organization to collect logs from multiple services and make them available in a standard format to multiple users.
Configure a Kafka Remote Log Collector
You can configure a remote collector to connect to a Kafka cluster defined by list of brokers. You can use Kafka clusters to manage the persistence and replication of message data. You can define Kafka topics, which represent the named stream of records. Messages are mapped to these Kafka topics based on topic map configuration. If there is no such mapping, the default topic is used for all logs.
To enable streaming to a non-default Kafka topic, issue the following commands on the Analytics node running the log collector exporter. Here, "threat-rule" is the unique exporter rule name, the the topic map number is an integer between 1 and 7 that corresponds to a topic map number assigned in the remote collector Kafka configuration.
admin@Analytics$ cli
admin@Analytics> configure
admin@Analytics% set log-collector-exporter exporter rules threat-rule set parameters topic topic-map-number
The following example associates topic map number 1 to topic name HI-PRI for a remote collector named kafka1:
admin@Analytics% set log-collector-exporter remote collectors kafka1 kafka topic-map 1 topic HI-PRI
Note: For Releases 21.2.3 and earlier, for standard Versa service logs, only the default topic is supported.
To display the Kafka remote collector configuration, issue the show log-collector-exporter remote collectors CLI command. For example:
admin@Analytics% show log-collector-exporter remote collectors kafka-west

transmit-rate 10000;         # Number of messages that would be transmitted per second
pending-queue-limit 100000;  # After the limit is hit, messages are dropped
template syslog-template;    # Template used for the message
kafka {
    brokers kafka-server:9092,kafka-server1:9092; # Broker list
    default-topic LO-PRIO;                        # Default topic, if no mapping found
    message-max-retries 3;   # Number of message retries by Kafka layer if ack not received
    health-monitoring {      # Health monitoring parameters
        error-threshold 20;                      # If number of errors exceeds this threshold
                                                 # in the last evaluation interval, health is set as
                                                 # “conn-err-exceeds-threshold“ and triggers switchover
        eval-interval 120;                       # Evaluation interval after which errors are reset
        clear-interval 300;                      # Interval after which connection health state is cleared
    }
topic-map 0 {                # Topic map configuration for logs received with flag 0
    topic HI-PRIO;           # Topic name mapped to logs received with flag 0
                             # of acks the leader broker must receive from ISR brokers
                             # before responding to the request:
    required-acks -1;        # 0 = No ack to client, 1 = Only the leader broker acks,
                             # -1 or all = broker blocks until message is committed by all in-sync
                             # replicas (ISRs) or broker's in.sync.replicas setting before sending response
    request-timeout-ms 5000; # How long broker wait to try to meet the required acks before
                             # sending an error to the client
    }
topic-map 1 {                # Topic map configuration for logs received with flag 1
    topic LO-PRIO;
    required-acks -1;
    request-timeout-ms 5000;
    }
}
To display the Kafka remote collector group configuration, issue the following CLI command:
admin@Analytics% show log-collector-exporter remote collector-groups

kafka-cg {
    collectors        [ kafka-east kafka-west ]; # List of clusters
    primary-collector kafka-west;                # Optional primary collector provides preference
                                                 # to the set collector
}
admin@Analytics% set log-collector-exporter remote collectors kafka1 kafka topic-map 1 topic HI-PRI
Configure Kafka SSL and SASL Authentication
You can stream logs to a Kafka cluster securely over a TLS connection. SSL authentication uses public keys such as client, server, and certificate authority for authentication, and Simple Authentication and Security Layer (SASL) authentication uses the username and password for authentication.
To configure Kafka SSL and SASL authentication:
- Enable TLS transport for Kafka SSL and SASL authentication:
admin@Analytics% set log-collector-exporter remote collectors kafka-east transport tls
- Verify that the transport is set to TLS:
admin@Analytics% show log-collector-exporter remote collectors kafka-east transport
transport           tls;
- Configure TLS attributes for SSL authentication. All TLS attributes are mandatory.
[edit log-collector-exporter remote collectors kafka-east tls-attributes]
admin@Analytics% show
ca-cert-path           /home/versa/certs/rootCA.crt;         # CA certificate in PEM format
priv-key-path          /home/versa/certs/kafka-prod.key;     # Private key
client-cert-path       /home/versa/certs/kafka-prod.crt;     # Client certificate (PEM)
auth-security-protocol ssl;                                  # TLS/SSL or SASL
- Configure TLS attributes for SASL authentication. All TLS attributes are mandatory.
[edit log-collector-exporter remote collectors kafka-east tls-attributes]
admin@Analytics% show
sasl-username          versa          # Username for SASL
sasl-password          password      # Password for SASL
sasl-mechanism         scram-sha-256  # SASL mechanism to be used
auth-security-protocol sasl-ssl       # SASL or TLS/SSL
View Kafka Remote Log Collector Status Statistics
By default, Kafka stores alert logs in the /var/log/syslog directory.
To check the Kafka log collector statistics:
- Verify the connection status:
admin@Analytics> show log-collector-exporter remote collectors kafka-connection
REMOTE
COLLECTOR                                                                   BROKER
NAME        BROKER LIST                                   BROKER STATE      HEALTH
------------------------------------------------------------------------------------------
kafka-east  kafka-server-sec:9092,kafka-server1-sec:9092  all-brokers-down  conn-healthy
kafka-west  kafka-server:9092,kafka-server1:9092          established       conn-healthy
- Verify the group status:
admin@Analytics> show log-collector-exporter remote collector-groups kafka-cg kafka-status
kafka-status
 primary-collector kafka-west
 active-collector  kafka-west
- Verify the group switchover status:
admin@Analytics> request log-collector-exporter remote collector-groups kafka-cg switchover to-collector kafka-east
status Switchover from kafka-west to kafka-east
- Verify the Kafka statistics:
admin@Analytics> show log-collector-exporter remote collectors kafka-west kafka-statistics
kafka-statistics
 message-sent               32794 =>  # of messages posted to kafka layer
 message-send-failures      0     =>  # of messages that could not be posted to kafka layer
 logs-in-queue              0     =>  # of logs pending to be processed in collector queue
 message-delivery-pass      32794 =>  # of messages that have got acked by the kafka broker
 message-delivery-fail      0     =>  # of messages that did not get ack from kafka broker
 message-diverted           0     =>  # of messages that are diverted to another broker as it could not be sent
 message-size-exceeds-limit 0     =>  # of messages exceeding transmit buffer limit. Not applicable for kafka
 message-exceeds-qlimit     0     =>  # of messages exceeding queue limit as it could not be processed fast enough
 message-params-invalid     0     =>  # of messages with invalid parameters
 transport-errors           0     =>  # of transport errors seen by this broker
 all-brokers-down           0     =>  # of times all brokers down message seen
 authentication-errors      0     =>  # of times authentication errors seen
 exceeds-threshold-errors   0     =>  # of times connection errors exceeds threshold (can trigger switchover)
                  MESSAGE
TOPIC    MESSAGE  SEND
NAME     SENT     FAILURES
----------------------------
HI-PRIO  32794    0               => # of messages sent and message sent failures per topic
LO-PRIO  0        0
- Clear the Kafka statistics:
admin@Analytics> request log-collector-exporter remote collectors kafka-west clear statistics
status Ok
Debug the Kafka Remote Log Collector Connection
To debug Kafka connections, issue the following CLI commands:
admin@Analytics> show log-collector-exporter remote collectors kafka-connection
admin@Analytics> show log-collector-exporter remote collectors kafka-connection broker-health
admin@Analytics> show log-collector-exporter remote collectors kafka-connection broker-state
admin@Analytics> show log-collector-exporter remote collectors kafka-statistics
Send Email Alerts and Notifications about Logs
For critical security events, you can configure an Analytics log collector node to send email alerts and notifications to users.
To configure an Analytics log collector node to stream email notifications, you do the following:
- Configure a remote collector to send logs to the system containing the notification agent.
- Install the notification agent.
- Configure the notification agent.
Configure the Remote Collector
You configure a remote collector to export specific types of logs to the local notification agent. First, configure the remote collector. Ensure that the IP address in the destination address field is a local IP address. The notification agent listens on TCP port 514, so configure this as the transport and destination port values.
admin@Analytics% show log-collector-exporter remote
templates {
    syslog {
        type   syslog;
        format kvp;
    }
}
collectors {
    notif-collector {
        destination-address 192.168.1.21;   <-- Local IP address
        destination-port    514;
        transport           tcp;
        template            syslog;
    }
}
profiles {
    notif-profile {
        collector notif-collector;
    }
}
Then configure the types of logs that you want to export to the log collector. For a list of log types that you can configure in the log-types field, see Configure Log Exporter Rules, above.
admin@Analytics% show log-collector-exporter exporter
rules {
    notif-rule {
        match {
            local-collector local-coll;
            log-types       [idp-log urlf-log ];
        }
        set {
            remote-collector-profile notif-profile;
        }
    }
}
Install the Notification Agent
To install the notification agent, you first verify that you have configured SMTP for the cluster, and that the Analytics nodes are listed as driver hosts in the main settings for the cluster. Then, you install the notification agent on each Analytics node that collects logs.
To install the notification agent for Analytics nodes that collect logs:
- In Director view, select the Analytics tab.
- Select Administration > Configuration > Settings > Main Settings.
- Verify that the Analytics nodes display in the Driver Hosts list. For any node that is not listed, enter its IP address, and then click + Add.
- Select Administration > Configuration > Settings > Email Configuration.
- Verify that email is configured for the Analytics cluster. For information about configuring email, see Configure SMTP in Perform Initial Software Configuration.
- (For Releases 22.1.4 and later.) To install the notification agent, perform the following steps on each Analytics node that collects logs:
- Select Analytics > Administration > System Configuration > Notification Agent Settings. Enter information for the following fields.
Field Description Notification Agent Hosts Enter the IP address of the Analytics driver host, then click +Add. Repeat this action for each Analytics node that collects logs. Collector Port Enter the port number for the notification agent. The default port used by the notification agent is 514. - Click Save. The notification agent hosts display in the Notification Agent Status table.
- Click Install in the Action column for each host. There is a 30 second delay while the notification agent installs. The host IP address, configured collector port, and SMTP parameters are posted to the notification agent, and the agent automatically starts.
- To manage the notification agent, select an action in the Action column: Start, Stop, Restart, or Uninstall.
- Select Analytics > Administration > System Configuration > Notification Agent Settings. Enter information for the following fields.
- (For Releases 22.1.3 and earlier) To install, configure, and manage the notification agent:
- In the CLI, issue the request system notification-agent install command.
admin@Analytics$ cli
admin@Analytics> request system notification-agent install
status success
result Installation initiated ... check /var/log/versa/van-notif-agent.log
admin@Analytics> exit
- Configure the notification agent, as described in Configure the Notification Agent, below.
- To manage the notification agent, issue the request system notification-agent action command from the CLI. Actions include restart, start, status, and stop.
admin@Analytics> request system notification-agent restart
status success
result Restart initiated, check if process is restarted by status option
- In the CLI, issue the request system notification-agent install command.
Configure the Notification Agent
For Releases 22.1.3 and earlier.
To configure the notification agent, modify the van-notif-agent.conf file, which is located in the /opt/versa_van/apps/van-notif-agent/etc directory. The contents of the van-notif-agent.conf file are similar to the following. The table below explains each of the fields in the file.
admin@Analytics$ cat /opt/versa_van/apps/van-notif-agent/etc/van-notif-agent.conf
[COLLECTOR]
# Directory where the notification events are temporarily stored
directory: /var/tmp/notifier
# Listen IP address and port to bind (typically local IP) where the
# log collector/exporter will export the logs.
# If 0.0.0.0 is specified, it will not bind to any specific IP.
ip: <ip>
port: <port>
# Transport on which logs are received from log collector/exporter
# Options: tcp/udp
protocol: tcp

# SMTP configuration
[SMTP]
# SMTP server hostname or IP address
host: hostname
# SMTP server port
port: port-number
# Email address of sender
sender: sender@versa-networks.com
# Subject of email
subject: Appliance Events
# Password of sender used to login to SMTP server
password: xxxxxxx

# Global Configuration
[GLOBAL]
# Comma-separated list of log types to process
threat_types: idpLog, ipfLog, urlfLog, dosThreatLog
# Comma-separated list of log subtypes to process
threat_subtypes: suspicious, high_risk, attempted-user
# Comma-separated list of log subtypes to skip
subtype_skip_list: allow, trustworthy
# Interval, in minutes, at which to send email notification
email_interval: 15
# If true, logs are printed in email
print_logs: false
# Comma-separated list of notification recipients
recipients: abc@versa-networks.com
# Number of events per email (recommended value = 25)
batch_size: 25
# Global timezone
timezone: UTC

# Per-tenant configuration
[tenant_tenant-name]
# Comma-separated list of log types to process
threat_types: idpLog, ipfLog, urlfLog, dosThreatLog
# Comma-separated list of log subtypes to process
threat_subtypes: suspicious, high_risk, attempted-user
# Comma-separated list of log subtypes to skip
subtype_skip_list: allow, trustworthy
# Interval, in minutes, at which to send email notification
email_interval: 15
# If true, logs are printed in email
print_logs: false
# Comma-separated list of notification recipients
recipients: abc@versa-networks.com
# Number of events per email (recommended value = 25)
batch_size: 25
# Tenant timezone
timezone: US/Pacific

# [tenant_tenant-name]
# threat_types: idpLog, ipfLog, urlfLog, dosThreatLog
# threat_subtypes: suspicious, high_risk, attempted-user
# Comma-separated list of log subtypes to skip
# subtype_skip_list: allow, trustworthy
# email_interval: 1
# print_logs: false
# recipients: email
# batch_size: 25
# timezone: Japan
| Field | Description |
|---|---|
| Collector Configuration (Group of Fields) | |
|
Temporary location in which to store the logs. |
|
IP address of the collector to receive the logs. Typically, this is a local IP address. If you configure the IP address 0.0.0.0, any IP address is used. |
|
Port to use to connect to the collector. |
|
Transport on which logs are received from the log collector:
|
| SMTP Configuration (Group of Fields) | |
|
IP address or FQDN of the SMTP server. |
|
Port to use to connect to the SMTP server. |
|
Email address of the sender to receive the email notification. This email address is also used as the username to log in to the SMTP server. |
|
Text string to use as the subject line in the email notification. |
|
Password of the sender to use to log in to the SMTP server. |
| Global and Tenant Configuration (Group of Fields) | Enter global values in the [GLOBAL] section of the van-notif-agent.conf file, and enter tenant-specific values in the [tenant] section. |
|
In the [tenant] section, enter the name of the tenant. For multiple tenants, configure multiple [tenant] sections. |
|
Comma-separated list of threat types for which to send email notifications. You can specify the following threat types:
|
|
Comma-separated list of threat log subtypes for which to send email notifications. Examples of subtypes are allow, deny, reject, and alert (for accessLog) and trustworthy, low_risk, high_risk, and moderate_risk (for urlfLog). |
|
Comma-separated list of threat log subtypes to skip and send no email notifications. |
|
How often to send email notifications, in minutes. No email notification is sent if no events occur during that time interval. |
|
Whether to attach the subscribed logs to the email notification:
|
|
Comma-separated list of email addresses of notification recipients. |
|
When print_logs is true, maximum number of logs to attach in the email notification. The recommended number of logs is 25. |
|
Timezone to include in the timestamp in the email notification. |
After you make any changes to the configuration for the notification agent, you must restart the notification service:
admin@Analytics$ sudo service van-notif-agent restart
You can also restart the notification service from the CLI:
admin@Analytics> request system notification-agent restart
status success
result Restart initiated, check if process is restarted by status option
View Notification Logs
The notification logs are stored in the /var/log/versa/versa-notif-agent.log file. To view, you can use the Linux cat or tail command. For example:
admin@Analytics$ sudo tail -f /var/log/versa/van-notif-agent.log
2020-07-17 14:30:30,098 - ParserService - INFO - Parser-stats  [Tenant-Common] [current=0] [errors=0] [total=0]
2020-07-17 14:30:30,099 - ParserService - INFO - Parser-stats  [Versa] [current=0] [errors=0] [total=0]
2020-07-17 14:30:30,099 - ParserService - INFO - Parser-stats  [Corp-Inline-Customer-1] [current=0] [errors=0] [total=200]
2020-07-17 14:30:34,915 - CollectorService - DEBUG - Event     [2020-07-17T21:30:34+0000] [urlfLog] [Corp-Inline-Customer-1]
2020-07-17 14:30:34,916 - CollectorService - INFO - Event-stats[Corp-Inline-Customer-1] [current=32] [total=232]
2020-07-17 14:30:35,106 - ParserService - INFO - Parser-stats  [Corp-Inline-Provider] [current=0] [errors=0] [total=0]
2020-07-17 14:30:35,107 - ParserService - INFO - Parser-stats  [Tenant-Common] [current=0] [errors=0] [total=0]
2020-07-17 14:30:35,107 - ParserService - INFO - Parser-stats  [Versa]
To view the supported timezones, issue the following command:
admin@Analytics$ /opt/versa_van/apps/van-notif-agent/src/helper.py timezones
Modify or Add a Local Collector
You can modify or add local collectors in the Versa Director GUI. Local collectors can identify flow logs and store them in a separate directory from other log types. This allows you to store the flow logs but not automatically process them into the Analytics datastore nodes. If required, you can manually process the flow logs into the Analytics datastore nodes by restoring them from the archive.
To modify or add a local collector:
- In Director view, select the Analytics tab in the top menu bar.
- Select an Analytics cluster node:
- For Releases 22.1.1 and later, hover over the Analytics tab and then select an Analytics node.
- For Releases 21.2 and earlier, select an Analytics node in the horizontal menu bar.
- Select Administration > Configurations > Log Collector Exporter in the left menu bar.
- In the Driver Hosts field, select the Analytics log collector node.
- Click the Local Collector tab. The following screen displays.

- Click the name of the log collector to modify, or click the Add icon to add a new log collector. To display and Add in the popup window, enter information for the following fields.
Field Description Collector Name (Required) Enter a name for the local log collector. Address Enter the IP address of the local log collector. Clients
Enter the IP prefix of the clients of the local log collector. Separate multiple clients with a comma. Port Enter the TCP port number of the local log collector. Maximum Connections Enter the maximum number of connections to the local log collector. When this limit is reached, the log collector stops accepting new connections. If you increase the maximum number, the load on the log collector also increases, which may result in a backlog in processing the logs. To determine whether the log collector can handle the higher log rate, monitor for backlogs using the headend monitoring tools. For more information, see Monitor Analytics Clusters Using Open Source Tools.
Default: 512
Note: If your ADC configuration includes ADC monitors, the monitors form TCP connections to the local collector and these connections are included in the connection count. You can opt to create dummy collectors for the ADC monitors to reduce the count. For more information, see Set Up a Local Collector, above.
Protocol (Releases 22.1.3 and later.) Enter the protocol number. Transport (Releases 22.1.3 and later.) Select the transport type. Storage (Group of Fields) Configure the storage information for the local log collector. - Directory
Enter the directory in which to store log files. The default is /var/tmp/log. If you are using a different directory, see Set Up an Additional Log Storage Directory, below.
Default: /var/tmp/log- Format
Select the format in which to store log files:
- Syslog
- File Generation Interval
Enter how often to create a new log file. - Maximum Logs per File
Enter the maximum number of log messages for each log file. Enable Category Click to configure flow logs. - Category Name
Select the category of logs to store in the directory listed in the next field. - Flow
- Directory
Enter the name of the directory in which to store flow logs. If you are storing the flow logs in a directory other than /var/tmp/log, see Set Up an Additional Log Storage Directory, below.
- Throttle
Enter how many logs across all the connections to allow per minute. Any flows exceeding this value are discarded until the beginning of the next minute. This settings applies only to logs being written to disk on the local system. Logs streamed to remote servers are not affected. - Disable
Click to not store any flow logs, either in the default or the configured directory. -
Click Save.
Set Up an Additional Log Storage Directory
When you configure a local collector to store logs in a directory other than /var/tmp/log, you must perform the following additional setup to allow storage and archiving of logs.
- Create a new log storage directory. This is the directory you specify when you configure the local collector.
- Create a new archive directory.
- Set up a cron job to archive the logs.
To create the log storage and log archive directories and archive the logs:
- Log in to the Analytics log collector node.
- From the shell, issue the sudo mkdir command to create the log storage directory. The example below creates the /var/tmp/flow-log directory for log storage.
admin@Analytics$ sudo mkdir /var/tmp/flow-log
- Create the log archive directory, again using the sudo mkdir command. The example below creates the /var/tmp/flow-archive directory for archive storage.
admin@Analytics$ sudo mkdir /var/tmp/flow-archive
- Create a cron job to archive the logs to the new log archive directory. (Type the command on a single line.) job-name is the name of the cron job. If you do not specify a job name, the cron job overwrites the default log archive job that archives logs in the /var/tmp/log directory.
sudo /opt/versa/scripts/van-scripts/log-archive-start source-directory destination-directory (hourly|daily|weekly)
[active|backup] [job-name] [checksum]
For example (type the command on a single line):
admin@Analytics$ sudo /opt/versa/scripts/van-scripts/log-archive-start /var/tmp/flow-log
/var/tmp/flow-archive hourly active flow-log-archive
- To check that the archive cron job has been created, display the files in the cron.d directory. The following example displays the flow-log-archive cron job created in the previous example:
admin@Analytics$ ls -tlr /etc/cron.d
total 20
-rw-r--r-- 1 root root 488 Mar  3  2017 munin-node
-rwxr-xr-x 1 root root 172 Aug 26 12:24 log-archive
-rwxr-xr-x 1 root root 103 Aug 26 12:24 vandb-repair
-rwxr-xr-x 1 root root 135 Sep  2 10:55 vandb-auto-delete
-rwxr-xr-x 1 root root 210 Sep  2 11:01 flow-log-archive
Modify Versa Analytics Driver Settings
For Releases 22.1.4 and later.
The Versa Analytics driver ingests logs into Analytics and search engines. You can modify the driver settings to optimize performance.
Note: The Versa Analytics driver automatically restarts when you save your settings in the procedure below.
To modify the Analytics driver settings:
- In Director view, select the Analytics tab in the top menu bar.
- Select Admin > Configurations > Log Collector Exporter.
- Select a node in the Driver Hosts drop-down list.
- Select System > VAN Driver Settings. The current settings display on the screen.

- Click Edit VAN Driver Settings. The following window displays.

- To edit VAN driver settings, enter information for the following fields.
Field Description Analytics Max Concurrent Batch Maximum number of concurrent batch write queries an Analytics driver process sends to the Analytics database. If the database is heavily loaded, a large number of concurrent batches can cause slowness in data retrieval.
Default: 1000
Range: 1 through 2000
Analytics Batch Max Size Maximum number of logs per batch. If the database is heavily loaded, a large batch size can cause slowness in data retrieval.
Default: 50
Range: 1 through 1000
Analytics Batch Min Size Minimum number of logs per batch.
Default: 10
Range: 1 through 100
Driver Process Count Number of Analytics driver processes running in parallel.
Default: 2
Range: 1 through 4
Search Stats Aggregation Select Enabled or Disabled to enable or disable search statistics aggregation. When groups of statistics are aggregated, they are stored in the Analytics database as either averages or sums, depending on the data type. This is useful for faster data retrieval when generating summary reports. It is recommended that you keep this setting enabled. When disabled, queries are sent directly to the search engine.
Default: Enabled
- Click Save. The Versa Analytics driver restarts with the modified settings.
Supported Software Information
Releases 20.2 and later support all content described in this article, except:
- For Release 21.1.1, you can match subtypes in a log collector exporter rule; you can configure TLS on connections to remote log collectors; you can configure email streaming and streaming to Kafka clusters; you can restore Analytics logs from the CLI; you can delete archived logs; you can specify a destination FQDN for a remote collector instead of a destination IP address; you can identify a primary remote collector in a remote collector group from the CLI; you can configure remote collector alarms.
- For Release 21.2.1, you can identify a primary collector when configuring a remote collector group from the Director GUI; local collectors can accept logs from VOS devices running newer versions of the IPFIX template.
- For Release 21.2.3 , you can configure a local collector to receive syslog format logs over TLS transport; you can configure local collectors to accept logs only from specified tenants; you can configure syslog priority values in a remote template.
- For Releases 22.1.1, you can filter alarm logs by alarm text in a log exporter rule; syslog identifiers flowMonDNSLog and saseWebLog are available; you can configure an exporter rule option to stream logs to a specific Kafka topic.
- Release 22.1.3 supports SASE web and DNS-monitoring logs.
- Release 22.1.4 (Service Release dated 2024-12-20) adds supports for appliance, rule order, and topic flag fields for exporter rules. You can specify Kafka parameters for a remote collector in the Director GUI. You can modify settings for the Versa Analytics Driver. Supports both one-way and mutual TLS for remote collectors.
- Release 23.1.1 adds support for cloning a log collector exporter template.
Additional Information
Analytics Log Collector Log Types Overview
Configure Log Export Functionality
Configure VOS Device Alarms
Manage Versa Analytics Log Archives
Monitor Analytics Clusters Using Open Source Tools
Perform Initial Software Configuration
Versa Analytics Configuration Concepts
Versa Analytics Log Collector Log Types
Versa Analytics Scaling Recommendations