Monitor Analytics Clusters
![]() For supported software information, click here.
For supported software information, click here.
A Versa Analytics cluster is a set of Analytics nodes that receives raw log messages (simply called logs) from Versa Operating SystemTM (VOSTM) devices and processes them. The nodes in the cluster can store the raw logs locally or forward them to remote systems. Nodes that store logs locally can process raw logs into datastores in the cluster before archiving them. Analytics nodes provide an interface into the cluster, called the Analytics application, that allows you to configure nodes and access the information in the datastores.
The following resources are critical for Analytics nodes to function:
- Log collector exporter program
- Analytics driver
- Analytics search engine
- Analytics non-SQL (noSQL) database
- Analytics application
These resources require the CPU, memory, and disk resources of the Analytics nodes to operate.
For a list of operating parameters for Versa Analytics clusters, see Analytics Cluster Node Recommendations.
This article describes how to monitor Analytics resources and critical functions in Analytics clusters. This article also describes how to monitor users accessing the Analytics application.
The following table describes each Analytics resource and critical function and how to monitor them from the Director menus.
| Analytics Function or Resource | Description | To Monitor or View |
|---|---|---|
|
Log collector exporter program |
An iteration of the log collector exporter program runs on all the Analytics log collector nodes in a cluster. This program performs the following operations for the node:
|
Monitor log collector exporter statistics:
See Display Log Collector Exporter Status, below. |
| Analytics driver |
All Analytics log collector nodes in a cluster run a copy of the Analytics driver. The driver performs the extract, transform, and load (ETL) operation on log files stored in /var/tmp/log. Note that the node is called a driver host. |
View a snapshot of the current status of the Analytics driver:
See View the ETL Status, below.
(For Releases 22.1.1 and later.) View detailed information about the status of logs processed by the Analytics driver.
Monitor usage over time for the Analytics driver:
See View the ETL Status, below. |
| Analytics search engine |
The search engine runs on search-type Analytics nodes, where it indexes logs and performs the search function for the cluster. For a description of Analytics node types, see Analytics Cluster Node Types in Versa Analytics Configuration Concepts. |
View a snapshot of the current status of search-type Analytics nodes:
See View the General Status of a Cluster, below.
Monitor the volume of logs stored in the search engine:
See Display Datastore Status, below. |
| Analytics noSQL database |
The noSQL database runs on analytics-type Analytics nodes, where it stores aggregated log data that is used for generating reports and populating GUI screens. |
View a snapshot of the current status of analytics-type Analytics nodes:
See View the General Status of a Cluster, below.
Monitor the top 5, 10, 15, or 20 features stored in the NoSQL database:
See Display Datastore Status, below. |
| Analytics application |
Each node in an Analytics cluster runs an iteration of the Analytics application. This application allows you to configure and monitor Analytics nodes and view Analytics dashboards for a cluster. When you select the Analytics tab in the Director GUI, you are using the Analytics application to interact with the cluster using your Director login credentials. For more information about the Analytics application, see Versa Director Nodes and Analytics Clusters in Versa Analytics Configuration Concepts. |
Monitor users currently accessing the Analytics application:
See Display Active Users, below.
Monitor login and logout times for Analytics application users:
See Display Analytics Application Logs, below. |
| CPU and memory |
All critical Analytics functions use CPU and memory. |
View a snapshot of current CPU and memory usage:
See View the General Status of a Cluster, below.
Monitor memory and CPU usage per node over time:
See Display Disk, Memory, and CPU Usage, below. |
|
Disk |
All critical Analytics functions and cron jobs that periodically archive logs use disk storage. In general, disk storage accumulates under the following directories and their subdirectories:
Note: Total disk should be at least twice that of actual storage. The extra space is required for database housekeeping (compaction) operations. If disk usage reaches 50%, disk cleanup should be performed or more storage added. When Analytics nodes use a large percentage of their disk space, the nodes' performance may be reduced or the nodes may even become inoperable. See Troubleshoot Analytics Disk Storage Issues. |
View a snapshot of current disk usage:
See View the General Status of a Cluster, below.
Monitor disk usage per node over time:
See Display Disk, Memory, and CPU Usage, below. |
View the General Status of a Cluster
You can display general information about a cluster, including software version information and resource usage for cluster nodes, using the Director GUI. When using the Director GUI to access Analytics information, you select a node in the Analytics cluster. The Director GUI communicates with the Analytics application running on the node, and the Analytics application relays information and instructions between the Director GUI and all nodes in the cluster. These nodes are configured as part of a connector to the Analytics cluster. For more information, see Configure an Analytics Connector in Perform Initial Software Configuration.
General Analytics cluster status includes information for search-type and analytics-type Analytics nodes. The search engine runs on search-type Analytics nodes, where it indexes logs and performs the search function for the cluster. The noSQL database runs on analytics-type Analytics nodes, where it stores aggregated log data that is used for generating reports and populating GUI screens. For a description of Analytics node types, see Analytics Cluster Node Types in Versa Analytics Configuration Concepts.
To view version information for an Analytics node:
- In Director view, select the Analytics tab in the top menu bar.

- Hover over the Analytics tab to display a list of Analytics nodes, and then select the node.
- Select Administration > Version in the left menu bar. The System Version screen displays, with information for the following fields.
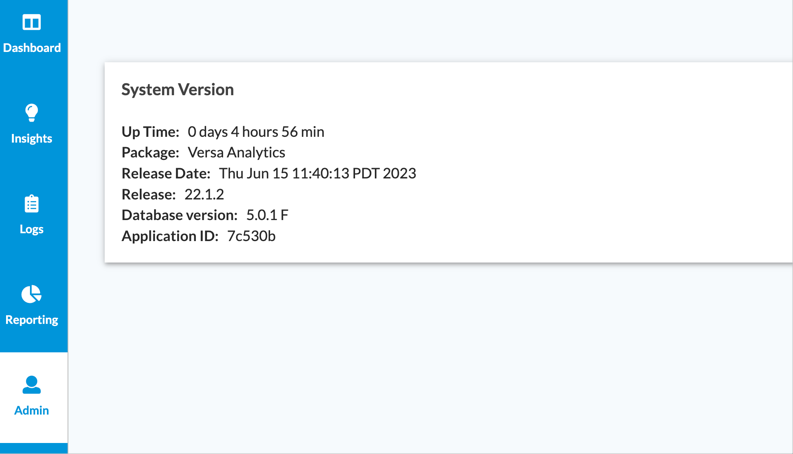
Field Description Up Time Time elapsed since the Analytics services were last restarted. Package Name of the Versa Analytics software package. Release Date Date that the installed Versa Analytics package was released. Release Release number. Database version Version of the database running on the cluster node. Application ID Application identifier. The application ID is used when configuring single sign-on. See Configure Single Sign-On Using Director.
To view a snapshot of current resource usage for cluster nodes running the search engine or noSQL database:
- In Director view, select the Analytics tab in the top menu bar.
- Hover over the Analytics tab to display a list of Analytics nodes, and then select any node in the cluster.
- Select Administration > System Status > Status in the left menu bar. The Cluster Status table displays with the following fields.

Field Description Data Center Type of cluster node:
- Analytics—Node is running the noSQL database.
- Search—Node is running the search engine.
Hostname Hostname or IP address of the cluster node. Status Status of the database or search engine:
- Down
- Up
State State of the database or search engine:
- Joining
- Leaving
- Moving
- Normal
Load (For Analytics data center nodes only.) Memory usage, in gibibytes (GiB).
Disk Free Remaining disk space, in gigabytes (GB). Disk Used (%) Disk space used as a percentage of total disk space. Disk Used Disk space used, in gigabytes (GB). Memory Used (%) (For search data center nodes only.) Memory usage as a percentage of total memory. CPU Load (%) CPU usage as a percentage of total CPU.
View Database Cleanup Information
By default, Analytics nodes run cron job /etc/cron.d/vandb-auto-delete automatically each night to delete database records that have exceeded their retention time. The cron job uses retention time settings you configure from the Director GUI; see Analytics Datastore Limits in Versa Analytics Scaling Recommendations.
To view the time that the cron job was last executed:
- In Director view, select the Analytics tab in the top menu bar.
- Hover over the Analytics tab to display a list of Analytics nodes, and then select any node in the cluster.
- Select Administration > System Status > Status in the left menu bar.
- Scroll down to display the data cleanup time.

View the ETL Status
All Analytics log collector nodes in a cluster run a copy of the Analytics driver. The driver performs the extract, transform, and load (ETL) operation on log files stored in /var/tmp/log. Note that the node is called a driver host.
To display the current ETL state of driver hosts, to display detailed ETL statistics, and to start or stop the Analytics driver on a node:
- In Director view, select the Analytics tab in the top menu bar.
- Hover over the Analytics tab to display a list of Analytics nodes, and then select any node in the cluster.
- Select Administration > System Status > Status in the left menu bar. The following screen displays.
- Scroll down to display the Agents & ETL Status table. The table displays the following fields.

Field Description Hostname Hostname or IP address of the driver host. Status Status of the driver host:
- Down
- Up
ETL State State of the Analytics driver:
- Down
- Running
Uptime Elapsed time since the Analytics driver was last started. Actions Click Stop to stop the Analytics driver on the node listed in the Hostname field.
Click Start to start the Analytics driver on the node listed in the Hostname field.
To display ETL error information and statistics over time:
- In the main pane, select the ETL Monitoring tab. The following charts display.

Chart Description ETL Errors (Group of Charts) - Analytics Errors
Cumulative number of ETL errors for analytics-type Analytics nodes in the cluster over time. - Processed Files
Number of processed log files over time. - Search Errors
Cumulative number of ETL errors for search-type Analytics nodes within the cluster over time. ETL Statistics (Group of Charts) - Pending Files
Number of pending log files over time. - Memory Usage
Memory usage of the Versa Analytics driver over time. - By default, the charts are refreshed every 5 seconds. To change the chart refresh rate, select a rate from the Refresh Interval field. Options are 2, 3, 5, and 15 seconds.
- To change the chart style, click the
 Chart icon and select a chart type. Options are area, bar, and line chart.
 - To view a chart in full-screen mode or to print or download a chart, click the
 Download icon. The following menu displays. Select one of the following fields:

Display Disk, Memory, and CPU Usage
All critical Analytics functions use CPU and memory. These critical functions also use disk storage which, in general, accumulates under the following directories and their subdirectories:
- Log storage directories, such as /var/tmp/logs
- Log archive directories, such as /var/tmp/archives
- NoSQL database storage directories, such as /var/lib/cassandra
- Search engine datastore directories, such as /var/lib/solr
You can display disk, memory, and CPU usage for the cluster as a whole and for individual cluster nodes. You can display current usage and usage over time.
To display disk, CPU, and memory usage:
- In Director view, select the Analytics tab in the top menu bar.
- Hover over the Analytics tab to display a list of Analytics nodes, and then select any node in the cluster.
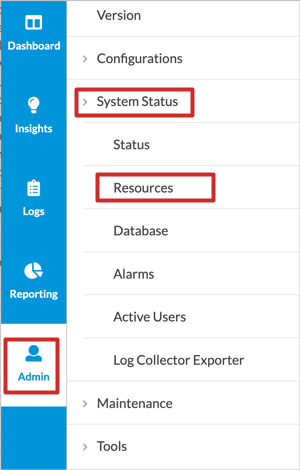
- Select Administration > System Status > Resources in the left menu bar. The Monitor Resources screen displays, showing charts for disk, memory, and CPU usage.

Chart or Table Description Disk Usage Disk usage over time as a percentage of total disk. Memory Usage Memory usage over time in gigabytes (GB). CPU Load CPU usage over time as a percentage of total CPU. Resources Usage (Table) Snapshot of current resource usage.
- Hostname
Hostname or IP address of the Analytics node. - Disk Used
Amount of disk space currently being used, in bytes. - Disk Used
Amount of disk space currently being used, as a percentage of the total filesystem disk space. - Memory Used
Amount of memory currently being used, as a percentage of total available memory. - CPU Load
Amount of CPU currently being used as a percentage of time that the CPU is not idle. - Select a time period to change the time period of the charts and table.

- (For Releases 21.2.1 and later.) To create a custom time range, select Custom range. The Select Custom Data/Time Range window displays. Enter information for the following fields, and then click OK.

Field Description Relative Range Click to specify a time range relative to the current time, and then enter a quantity in the first field and select a unit. Date Range Click to specify a time range between a beginning and ending time, and then enter the following:
- In the From field, enter a beginning date and then select a beginning time.
- In the To field, enter an ending date and then select an ending time.
Business Hours (For Releases 22.1.1 and later.) Click to specify a set of business hours, and then:
- Click individual days to indicate the days of business hours.
- Enter the starting and ending time of business hours.
Display Datastore Status
To display the number of logs by tenant for the search engine and logs for the top ten features for the noSQL database:
- In Director view, select the Analytics tab in the top menu bar.
- Hover over the Analytics tab to display a list of Analytics nodes, and then select any node from the cluster.

- Select Administration > System Status > Database in the left menu bar. The Monitor Databases screen displays the following charts and tables.

Chart or Table Name Description Tenants Search Logs Volume (Chart) Count of log messages sent to the search engine over time. To change the chart type, click the Chart icon and then select a chart type. Hover over a time or date in the chart to display details about global, provider, and tenant log counts.Features (Chart) Top 5, 10, 15, or 20 features present in the noSQL database. To choose the number of top features, click the Chart icon and then select a number. For chart types that do not display a number of hits or usage percentage, hover over the feature name to display these values.Tenants Search Logs Volume (Table) Count of log messages sent to the search engine. - Date Time
Date and time that the log was sent. - Tenant
Name of the tenant. - Log Count
Number of logs sent to the search engine. Usage Stats (Table) Usage statistics, for the selected time period, related to the search engine and noSQL database.
Monitor Analytics Cluster Alarms
For information about managing and viewing cluster alarms, see Analytics Cluster Alarms in Configure Analytics Alarms.
Display Active Users
Each node in an Analytics cluster runs an iteration of the Analytics application. This application allows you to configure and monitor Analytics nodes and view Analytics dashboards for a cluster. When you select the Analytics tab in the Director GUI, you are using the Analytics application to interact with the cluster using your Director login credentials. For more information about the Analytics application, see Versa Director Nodes and Analytics Clusters in Versa Analytics Configuration Concepts.
You can display information about users who are currently accessing the Analytics application. This includes users accessing the Analytics application from any of the following sources:
- Analytics tab in the Director GUI
- HTTPS connection to port 8443 on an Analytics cluster node
- API connection to the Analytics application
To display user login and logout times, see Display Analytics Application Logs, below.
To display a list of active users currently accessing the Analytics application:
- In Director view, select the Analytics tab in the top menu bar.
- Hover over the Analytics tab to display a list of Analytics nodes, and then select any node from the cluster.

- Select Administration > System Status > Active Users in the left menu bar. The Active Users screen displays with the following fields.

Field
Description Username
Login name of the active user. Login Time
Time that the user logged in. Roles
Role of the active user. For a description of user roles, see View User Roles in Configure AAA. Remote Address
IP address from which the user logged in.
Display Log Collector Exporter Status
You can display statistics for the log collector exporter program running on a driver host. This program can run on multiple driver hosts in a cluster, so ensure that you select the appropriate driver host when you display statistics.
An iteration of the log collector exporter program runs on all the Analytics log collector nodes in a cluster. This program performs the following operations for the node:
- Process incoming log export functionality (LEF) connections containing logs.
- Store raw logs to the local filesystem.
- Initiate TCP, TLS, or UDP connections to remote hosts.
- Identify logs to stream to remote hosts using exporter rules.
- Stream logs to remote hosts.
For more information about the log collector exporter, local collectors, remote collectors, and exporter rules, see Configure Log Collectors and Log Exporter Rules.
To display log collector exporter status information:
- In Director view, select the Analytics tab in the top menu bar.
- Hover over the Analytics tab to display a list of available Analytics nodes, and then select any node in the Analytics cluster.

- Select Administration > System Status > Log Collector Exporter in the left menu bar. The Log Collector Exporter Status screen displays.

- In the Driver Hosts field, select an individual node to display information for only that node, or select All to display information for all nodes in the cluster. The screen displays the following information for the selected driver host or hosts.
Field Description System Package Information (Group of Fields) - Host
Name of the driver host. - Package ID
Software package ID of the Analytics image installed on the driver host. - Package Name
Software package name of the Analytics image. - Version
Software package version. - Creator
Creator of the software package. - Major
Major release number of the software package. - Minor
Minor release number of the software package. - Service
Service release number of the software package. - Release Type
Software release type. Release types include GA (general availability). - Date
Date of the software release, in the format yyyymmdd. For example, 20210910 is September 10, 2021. System Uptime (Group of Fields) - Collector
Name of the driver host. - Start Time
Date and time that the driver host was last booted. - Uptime
Time elapsed since the driver host was last booted. - To display the status of connections to a driver host or hosts, select the Global Statistics tab. The following information displays.

Field Description Host
Name of the driver host. Active Connections
Number of active LEF connections. Clients Connected
Number of clients connected to the driver host. Clients Disconnected Number of clients that have disconnected from the driver host. Clients Connection Error Number of connection errors. Clients Rejected Number of client connections rejected by the driver host. Client Connections Exceeds Limit Number of connections that exceeded the connection limit. For information about limiting the number of connections accepted by a local collector, see Modify or Add a Local Collector in Configure Log Collectors and Log Exporter Rules. Messages Received/second Number of log messages received per second. Messages Parsed/second Number of log messages parsed per second. Flow Logs Received/second Number of flow logs received per second. Flow Logs Received Total number of flow logs received. Flow Logs Throttled Total number of flow logs throttled. For information about enabling flow log throttling, see Modify or Add a Local Collector in Configure Log Collectors and Log Exporter Rules.
- To display statistics for local collectors configured on a driver host or hosts, select the Local Collector Statistics tab. The following information displays.

Field Description  Eye icon
Click to display detailed statistics for the local collector.  Clear icon
Click to clear statistics for the local collector. Host
Name or IP address of the driver host. Local Collector
Name of the local collector. Connected Clients
Number of clients connected to the local connector. Rejected Clients Number of client connections rejected by the local connector. Data Records Received Number of data records received. Template Records Received Number of template records received. Messages Received Number of log messages received. Message Parsing Failed Number of log messages that could not be parsed. Records Stored Number of records stored. Remote Profile Not Found Number of times a remote profile associated with the local collector was not found. Remove Collector Enqueue Failed Number of times the local collector failed to add an item to the queue. - To display the status of local collector connections on the current driver host or hosts, select the Local Collector Connections tab. The following information displays.

Field Description Clear iconClick to clear the statistics. Host
Name or IP address of the driver host. Local Collector
Name of the local collector on the driver host that receives the connections. Tenant Name of the tenant that originated the connection. Appliance Name of the appliance that originated the connection. Messages Parsed Number of incoming log messages parsed. Messages in Queue Number of unprocessed log messages still in the queue. Client Socket Client socket number. Client IP IP address of the return connection to the client. Client Port Port number of the return connection to the client. - To display remote collector statistics for the current driver host or hosts, select the Remote Collector Statistics tab. The following information displays.

Field Description Clear iconClick to clear the statistics. Host
Name of the driver host. Remote Collector
Name of the remote collector. Logs in Queue Number of logs in the queue. Messages Sent Number of messages sent. Message Send Failures Number of messages that failed to send. Message Size Exceeds Limit Number of messages that exceeded the message size limit. Message Exceeds QLimit Number of messages that exceeded the size of the queue. - To display remote collector connections for the current driver host or hosts, select the Remote Collector Connections tab. The following information displays.

Field Description Clear iconClick to clear the statistics. Host
Name or IP address of the driver host. Remote Collector Name of the remote collector. Server Address IP address of the remote server. Connection State Connection state to the remote server. Client Socket Socket number of the connection. Server Port Port number of the connection. Transport Type Transport type of the connection to the remote server. Flaps Number of times the remote collector connection changed states between up and down in a short period of time, known as a flap. Last Flapped Most recent time that the connection flapped. - To display exporter rules for the current driver host or hosts, select the Exporter Rules tab. The following information displays.

Field Description Clear iconClick to clear the statistics. Host
Name or IP address of the driver host. Rule Name Name of the exporter rule. Rule Hit Count Number of times the rule has been invoked. Remote Collector Profile Remote collector profile used by the exporter rule. Local Collector Local collector used by the exporter rule. Tenants Number of tenants whose logs have invoked the rule. Log Types Log types exported by the rule. - (For Releases 22.1.1 and later.) To display statistics for the Analytics driver on a node or nodes in a cluster, select the Driver Statistics tab. The following information displays.

Field Description Host
Name or IP address of the driver host. Analytics Errors Number of errors encountered with the noSQL database.
Search Errors Number of errors encountered with the search engine. File Errors Number of file errors. Files in Queue Number of files currently in queue. Log Errors Number of log errors. Memory Usage Memory usage of driver. Total Logs Processed Number of logs processed. Analytics Queries Number of analytics queries. Search Queries Number of search queries. Processing Log Rate Rate at which logs are processed by the Analytics driver. Analytics Query Rate Query rate for analytics data. Search Query Rate Query rate for search data. Search Batch Query Dropped Number of times a search batch query was dropped. Search Queue Full Number of times the search queue was full.
- (For Releases 22.1.3 and later.) To display statistics for the events list for on a node or nodes in a cluster, select the Events List tab. An event is marked when the Versa Analytics monitor detects high resource utilization on Analytics nodes. The screen lists the event cause and a suggested action. This helps to troubleshoot Analytics resource issues quickly.

Field Description Event Host
Name of Analytics host where the event occurred Event Time Time of the event Event Description of the event Event Type Type of the event Event Cause Cause of the event Event Action Suggested action to take Event Details Details of the event
Display Analytics Application Logs
The Versa Analytics application runs on all nodes in an Analytics cluster. The Analytics application generates syslog messages that you can display in the Versa Director GUI. Messages are assigned syslog severity levels of error, warning, info, debug and trace, and include information about changes in Analytics alarm thresholds, Analytics database activities, and user logins and logouts.
To display Analytics application syslog messages:
- In Director view, select the Analytics tab in the top menu bar.
- Hover over the Analytics tab to display a list of Analytics nodes, and then select any node in the cluster.

- Select Administration > System Status > Maintenance > Application Logs in the left menu bar. The last 250 syslog messages of all severity levels display.

- To display a specific number of rows, enter a number into the In The Last field and then click Refresh.
- To display logs for a specific severity level, select a value from the Level field.
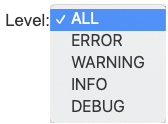
Field Severity Level All Display log messages at all syslog severity levels. Error Display error log messages only. Warning Display warning log messages only.
Info Display info log messages only. Debug Display debug and trace log messages only. - Click Refresh.
Reduce Resource Usage
The following table describes actions you can take to reduce resource usage on Analytics nodes.
|
Goal |
Actions |
|---|---|
|
Reduce the number of LEF connections |
|
|
Reduce incoming log volume |
|
|
Reduce datastore size |
|
|
Reduce raw log storage |
|
|
Reduce archive storage |
|
| Reduce resource usage |
|
Supported Software Information
Releases 20.2 and later support all content described in this article, except:
- Release 20.2.3 adds the uptime field on the System Version screen; you can display status and statistics for the log collector exporter.
- Release 21.1.3 enhances Analytics device alarm settings.
- Release 21.2.1 adds custom time ranges for graphs.
- Release 22.1.1 adds the Driver Statistics tab on the Log Collector Exporter Status screen; you can specify business hours in a custom date and time range.
Additional Information
Configure an Application Delivery Controller
Configure Log Collectors and Log Exporter Rules
Configure Log Export Functionality
Configure Single Sign-On Using Director
Configure VOS Device Alarms
Manage Versa Analytics Log Archives
Perform Initial Software Configuration
Troubleshoot Analytics Disk Storage Issues
Versa Analytics Configuration Concepts
Versa Analytics Scaling Recommendations