Overview of Analytics Dashboards, Insights, Log Screens, and Reports
![]() For supported software information, click here.
For supported software information, click here.
Versa Operation SystemTM (VOSTM) devices collect log information for features and services and then forward the logs to a set of nodes called an Analytics cluster. The cluster stores the logs in a searchable datastore, and it also analyzes the logs and stores the analysis in a database. The datastore and database are normally configured in redundant, high-availability sets within the cluster. Both the datastore and database are referred to as datastores.
You can configure the inclusion or exclusion of data for specific features or services of Analytics data shown on dashboards and log screens. If the retention of data for a specific feature or service has been disabled for cluster datastores, then corresponding dashboards and log screens display no information. For information about including or excluding features or services from the datastores, see the "path to the configuration screen" item at the beginning of the section for the feature or service in Apply Log Export Functionality.
You can view datastore data on Analytics dashboards, log screens, and through Analytics reports. For Releases 23.1.1 and later, you can view Analytics insights. This article describes the dashboards, insights, log screens, and reports and how to access them from the Director GUI.
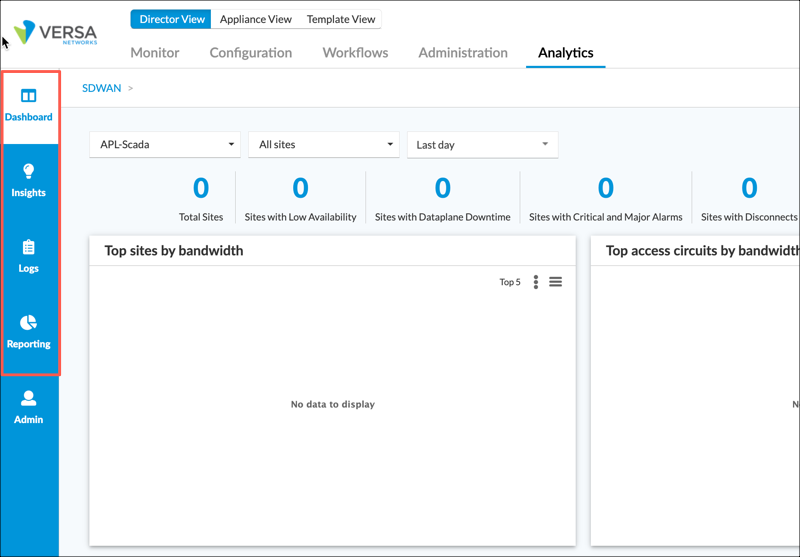
For Releases 22.1.1 and later, you access Analytics dashboards from Analytics > Dashboard, Analytics log screens from Analytics > Logs, and Analytics reports from Analytics > Reporting. For Releases 23.1.1 and later, you can view Analytics insights from the Analytics > Insights tab.

For Releases 21.2 and earlier, you access Analytics dashboards and log screens from Analytics > Dashboard, and you access reports from Analytics > Reporting, as shown in the following screenshot.

Dashboards
Analytics dashboards present analyzed log information on a per-tenant basis as charts, tables, map, and, for Releases 21.2.1 and later, as brief summary information called statistics blocks. You can customize dashboards to display information for different tenants, time periods, and sites. You can choose a chart style and metric for a chart, and you can export charts and tables to your local system. For information about using dashboards, see View Analytics Dashboards and Log Screens.
The following are the four categories of dashboards:
- SD-WAN—SD-WAN information, such as site usage and availability. For more information, see SD-WAN Dashboards.
- Secure Access—Versa secure access information, such as top appliances by user count. For more information, see Secure Access Dashboards.
- Security—NGFW information, such as top URL categories. For more information, see Security Dashboards.
- System—VOS device information, such as WAN utilization over time. For more information, see System Dashboards.
Insights
For Releases 23.1.1 and later.
Versa provides support for Analytics insights using various observability data.
You can view insights in the following categories:
- Sites—Sites with local, network, and unknown issues, and links with LTE, WAN utilization, and interface flap Issues.
- Traffic—Unknown TCP, UDP, and SSL traffic and unknown traffic summary. Detection of large uploads and fat flows.
- Application experience—Web traffic and voice/video traffic performance.
For more information about insights, see View Analytics Insights.
Log Screens
Analytics log screens present log information on a per-tenant basis in the form of sortable and searchable log tables. You can customize log screens to display logs tables for different tenants, time periods, and sites. Some log screens also include charts that graphically present information from the log tables. You can download log charts and tables to your local system.
For information about using log screens, see View Analytics Dashboards and Log Screens.
Reports
Analytics reports present information on a per-tenant basis for a specific time period as charts and tables. You customize the charts and tables, by choosing specific appliances, chart styles, metrics, and filters for the charts and tables to include in a report. You create reports by first configuring a report template and then generating reports from the template, either on demand or at preset times. Reports are stored in the Analytics database, and you can export them in PDF or CSV format.
For information about creating report templates and managing reports, see Manage Custom Reports.
Supported Software Information
Releases 20.2 and later support all content described in this article, except:
- Release 23.1.1 adds support for the Insights tab.
