Secure Access Dashboards
![]() For supported software information, click here.
For supported software information, click here.
Versa secure access (VSA) collects statistics about a tenant's VSA users that you can view on an Analytics dashboard. To forward the VSA information shown on the screens in this article, you associate a LEF profile with the secure access configuration so that VSA logs are forwarded to the destination addresses associated with the profile. For more information, see Configure the Versa Secure Access Service.
This article describes the Secure Access dashboards, which are located at Analytics > Dashboards > Secure Access dashboards:
- Top-level secure access dashboard—Displays summary and historical information about VSA gateways
- Users—Displays information about VSA gateway users
- Users View—Displays maps that report statistics about a VSA tenant's users
- Digital Experience—Displays digital experience monitoring (DEM) information about users and applications.
- SASE for SIM—Displays information about SIM-enabled IoT and user devices.
For general information about how to use an Analytics dashboard, see View Analytics Dashboards and Log Screens.
Top-Level Secure Access Dashboard
To view summary and historical information about VSA gateways, select the top-level Secure Access dashboard, at Analytics > Dashboards > Secure Access.
The Secure Access dashboard displays summary and historical information about VSA gateways for the organization that is selected in the first drop-down menu in the main pane. (In the screenshot below, the organization is Corp-Inline-Customer-1.)
The top-level secure access dashboard displays the following items:
- Secure access statistics block—Displays counts for the number of failed and successful login attempts and the total number of secure access users.
- Statistics table—Per-appliance login attempts and concurrent users.
- Statistics by Concurrent Users chart—Select a chart metric in the drop-down list for the chart: Concurrent Users, IPsec Concurrent Users, or SSL Concurrent Users.
- Statistics by Attempt chart—Select a chart metric in the drop-down list for the chart: Attempts, IPsec Attempts, and SSL Attempts.

Secure Access Users Dashboard
The Secure Access Users dashboard displays information about VSA gateways for the selected organization. To view the Secure Access Users dashboard, select Analytics > Dashboards > Secure Access > Users.

The Secure Access Users dashboard displays the following tabs in the horizontal menu:
- Summary
- Usage
- Events
- Registry
Summary Tab
To view secure access information by VOS device, continent, country, and city, select Analytics > Dashboards > Secure Access > Users > Summary.
The Summary tab displays the following charts a table:
- Top Appliances by User Count
- Top Continents by User Count
- Top Countries by User Count
- Top Cities by User Count
- User Count Table

To view VSA user traffic for a VOS device, in the User Count Table, select the Zoom icon in the same row as the VOS device. For example, selecting appliance HE-DC-Branch-1 displays the following screen:

To view VSA statistics about the user for a VOS device, in the Users table, select the Zoom icon in the same row as the username.
The screen displays the following items:
- Statistics for username Through device (chart)
- Statistics for username Through device (table)

Usage
To view secure access user usage statistics, select Analytics > Dashboards > Secure Access > Users > Usage.
The Usage tab displays the following charts and table:
- Statistics per User
- Top Users
- Statistics per User

To view statistics for a specific user, select the user in the Statistics per User chart. The screen displays the following charts and table:
- Statistics for username (chart)
- Top Applications of username
- Business Tags of username
- Categories of username
- Statistics for username (table)

Events
To view secure access events per user, type, and authentication failures, select Analytics > Dashboards > Secure Access > Users > Events.
The Events tab displays the following charts and table:
- Events per User
- Events per Type
- Events—Note that for this table, the city and country are derived from the latitude and longitude.

To view event statistics for the user, in the Events per User chart, drill down on a user's email address. The following screen displays.

To view statistics for an event type, in the Events per Type chart, drill down on an event type. The following screen displays.

Registry
To view secure access registry information, select Analytics > Dashboards > Secure Access > Users > Registry.
The Registry tab displays the following charts and table:
- Top Client OS
- Top Secure Access Client Version
- Appliances With Secure Access Users
- Registrations

The Registrations table displays the following fields.
| Field | Description |
|---|---|
| Date, Time | Displays the date and time of user registration. |
| Appliance | Displays the name of the remote access gateway device. |
| Users | Displays the username. |
| OS | Displays the name of OS running on the device on which the VSA client is installed. |
| OS Version | Displays the OS version. |
| Client Version | Displays the VSA client version. |
| Latitude, Longitude | Displays the latitude and longitude of the VSA client. |
Secure Access Users Map
To view maps that report statistics about a VSA tenant's users, including a summary of the top users and bandwidth usage over time, select Analytics > Dashboards > Secure Access > Users Map.

The Users Map dashboard displays the following.

To change the type of data displayed on the map, select a view from the drop-down menu on the map. You can select one of the following views:
- User Network view—Displays the geographical location of active users during the selected time range
- User Traffic view—Displays both the geographical location of active users and their connection to a remote access gateway.
In both User Network and User Traffic view, click a ![]() User icon to view a popup card that contains the following information:
User icon to view a popup card that contains the following information:
- User—Name of the user
- IP—User's WAN IP address
- ISP—Internet service provider through which the user connects
- RAS—Remote access server through which the user connects
To change the map zoom level, use the Plus and Minus icons.
To change the map center, drag the map with your mouse.
To return the map to its original center and zoom level, click the ![]() Reset icon.
Reset icon.
To manually refresh the display, click the ![]() Manual Refresh icon.
Manual Refresh icon.
Digital Experience Monitoring Dashboard
For information about digital experience dashboards, see View Digital Experience Monitoring Dashboards.
SASE for SIM Dashboard
For Releases 23.1.1 and later.
SASE for SIM authenticates and authorizes devices using international mobile subscriber identity (IMSI) or International Mobile Equipment Identity IMEI identifiers.
The SASE for SIM dashboard displays the following information:
- Accounting stops and starts statistics. Accounting starts and stops mark the start and end of accounting for a user session.
- Usage statistics for active SASE for SIM users.
- Top applications, application categories, and HTTP protocol access for individual users.
- Top threats detected by AV, IDP, ATP, DLP, and CASB for individual users.
- Policy violations detected by URL filtering, IP filtering, DNS filtering, and file filtering for individual users.
To display SASE for SIM information for a tenant:
- Select Analytics > Dashboards > Secure Access > SASE on SIM.
- Select a tenant in the first drop-down list in the horizontal menu bar.
- Select a time range in the third drop-down list.

The screen displays the following:
- SASE for SIM statistics block:
- Accounting Starts—Sum of all accounting starts across all gateways for the selected time range.
- Accounting Stops—Sum of all accounting stops across all gateways for the selected time range.
- Total Users—Total number of unique SASE for SIM users active for the selected time range.
- Summary tab
- Users tab
SASE for SIM Summary Tab
Select the Summary tab to display SASE for SIM statistics by appliance for the selected tenant.

SASE for SIM Users Tab
To displayed detailed information about active users for the selected tenant, select the Users tab. The User Stats table displays.
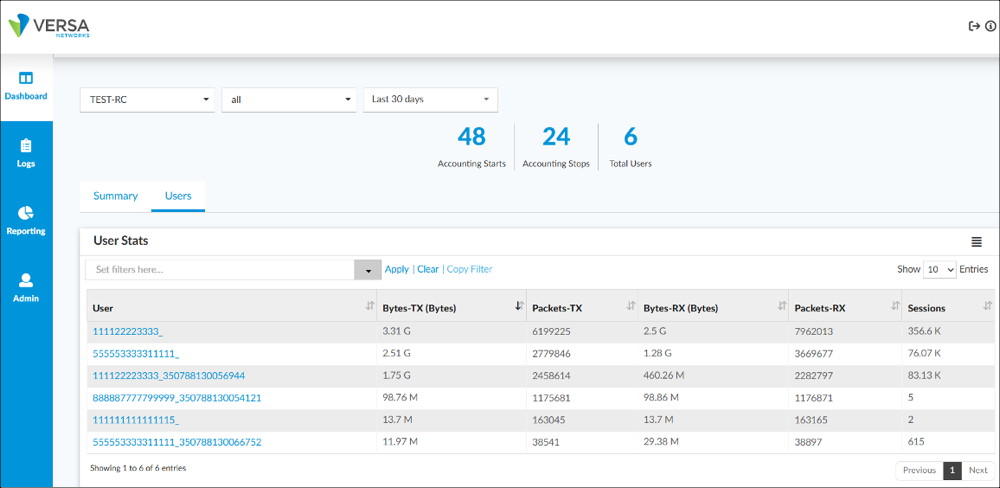
Select an IMSI/IMEI identifier in the User column to display detailed information for the user.
The screen displays the following tabs:
- Activity
- Threats
- Policy Violations
- Logs
Activity
Select the Activity tab to display the following charts for the selected user:
- Top URL Categories (pie chart)
- Top URL Categories (sessions over time chart)
- Top Applications
- Top Application Category
- Top HTTP Protocol
- Top Blocked Applications
- Top Blocked URL Categories
- Top Threat/Policy Violations


Threats
Threats are detected by features such as antivirus software, intrusion detection and prevention (IDP), advanced threat protection (ATP), data loss prevention (DLP), and cloud access security broker (CASB).
Select the Threats tab to display detected threats for the selected user. The following charts display:
- Threat Activity Over Time
- Top Threat Types
- Top Infected Applications


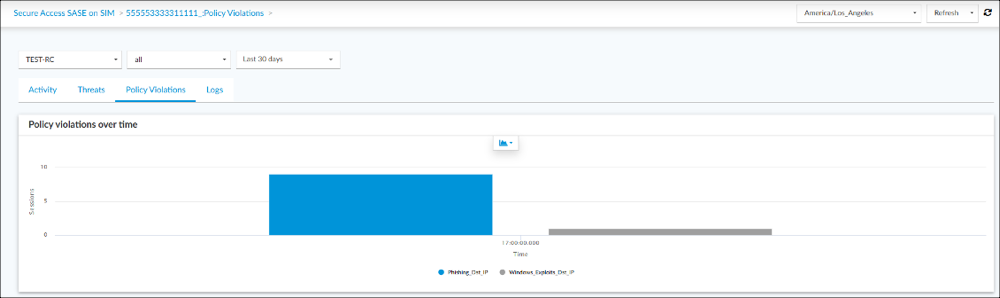
Policy Violations
Policy violations are detected by features such as URL filtering, IP filtering, DNS filtering, and file filtering.
Select the Policy Violations tab to display policy violation information for the selected user. The following charts display:
- Policy Violations over Time
- Top Policy Violation Types
- Top Applications with Policy Violations

Logs
To display SASE web monitoring logs for IMSE/IMEI users, select the Logs tab.
Note: To populate this table, you must configure settings on gateway devices to enable the export of Web monitoring logs by IMSI/IMEI identifier. For more information, see Configure SASE Web-Monitoring Logging in Apply Log Export Functionality.

Supported Software Information
Releases 21.2.1 and later support all content described in this article, except:
- Release 22.1.1 adds support for Digital Experience dashboards.
- Release 23.1.1 adds support for SASE for SIM dashboards.