Analytics Log Screens by Title
![]() For supported software information, click here.
For supported software information, click here.
An Analytics node displays information about the Controller nodes and devices in its network on a series of log screens in the Versa Director GUI. This article lists the charts, maps, and tables available on the Analytics log screens. Each chart, map, or table is listed by its title, to help you search for a specific chart or table.
The sections in this article are organized in alphabetical order, with one section for each log screen.
Each section contains a three-column table that describes the following:
- Column 1 shows the title of each chart, map, and table on the log screen. Each title is followed, in parentheses, by its item type: chart, map, or table.
- Column 2 displays a thumbnail of the log screen. Click the thumbnail to display the full-sized screen in a new tab. Note that menu items can vary by release and may not exactly match what you see in your Director GUI.
- Column 3 describes how to navigate to the log screen in the Director GUI. The navigation instructions assume that you have selected a node residing in the Analytics cluster whose datastores contain the information for the log screens.
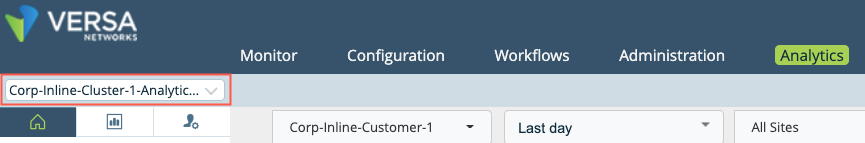
For Releases 22.1.1 and later, select the Analytics tab and then hover over the tab and select a node.

For Releases 21.2 and earlier, select the Analytics tab and then select the Analytics node in the horizontal menu bar.
For an individual feature or service, you can configure the data that you want to include or exclude on each Analytics log screen. If you have disabled data retention for a feature or service for cluster datastores, the corresponding logs screens display no information. For information about including or excluding features or services from the datastores, see the Path to the Configuration Screen paragraph at the beginning of the section for the feature or service in Apply Log Export Functionality.
If you are using the Versa advanced logging service (ALS), some charts, maps, and tables are populated from the datastores in the cloud-based Versa ALS cluster. You can configure whether charts, maps, and tables use data from the local cluster or from the ALS cluster from the Administration > Configurations > Settings > Data Configurations > Search Data Configurations screen. For more information, see Configure a Connector in Configure the Versa Advanced Logging Service.
ADC Log Screens
| Chart, Map, or Table Title | Thumbnail | Navigation to Chart, Map, or Table |
|---|---|---|
|
ADC Logs
|
|
|

Alarm Log Screens
| Chart, Map, or Table Title | Thumbnail | Navigation to Chart, Map, or Table |
|---|---|---|
|
Alarm Logs
|
 |
|
|
Alarm Log Charts
|

|
|
|
Alarm Events for Device
|
|
|
|
Alarm Events for Severity Level
|
|
|
|
Alarm Events for Alarm Type
|
|
|
|
Alarm Events for Alarm Event Type
|
|
|
|
Alarm Log Summary
|
 |
|
Authentication Log Screens
| Chart, Map, or Table Title | Thumbnail | Navigation to Chart, Map, or Table |
|---|---|---|
|
Authentication Events Logs
|
|
|
|
Authentication Policy Logs
|
|
|
|
Authentication Log Charts
|
 |
|
|
Authentication Events for Authentication Profile
|
|
|
|
Authentication Events for Authentication Status
|
|
|
|
Authentication Events for Authentication Rule
|
|
|
|
Authentication Events for Policy Rule Action
|
|


CASB Log Screens
| Chart, Map, or Table Title | Thumbnail | Navigation to Chart, Map, or Table |
|---|---|---|
|
CASB Logs (for Releases 22.1.3 and later)
|
 |
|
CGNAT Log Screens
| Chart, Map, or Table Title | Thumbnail | Navigation to Chart, Map, or Table |
|---|---|---|
|
CGNAT Logs
|
|
|
|
CGNAT Log Charts
|
|
|
|
CGNAT Events for Protocol
|
 |
|
|
CGNAT Events for Post-NAT Source IP Address
|
|
|
|
CGNAT Events for Destination IP Address
|
|
|
|
CGNAT Events for Source IP Address
|
|
|


DHCP Log Screens
| Chart, Map, or Table Title | Thumbnail | Navigation to Chart, Map, or Table |
|---|---|---|
|
DHCP Logs
|
|
|

DLP Log Screens
For Releases 22.1.3 and later.
| Chart, Map, or Table Title | Thumbnail | Navigation to Chart, Map, or Table |
|---|---|---|
|
DLP Logs
|
 |
|
DNS Log Screens
| Chart, Map, or Table Title | Thumbnail | Navigation to Chart, Map, or Table |
|---|---|---|
|
DNS Filtering Logs (for Releases 22.1.1 and later)
|
|
|
|
DNS-Tunneling Logs (for Releases 22.1.1 and later)
|
|
|
|
DNS Proxy Logs
|
|
|
|
DNS-Monitoring Logs (for Releases 22.1.1 and later)
|
|
|
|
DNS Log Charts
|
|
|
|
DNS Events for Filtering Profile
|
|
|
|
DNS Events for Filtering Action
|
|
|
|
DNS Events for Filtering Message Type
|
|
|
|
DNS Events for Redirect Rules
|
|
|
|
DNS Events for Proxy Actions
|
|
|
|
DNS Events for Proxy Query Types
|
|
|


EIP Log Screens
For Releases 22.1.3 and later.
| Chart, Map, or Table Title | Thumbnail | Navigation to Chart, Map, or Table |
|---|---|---|
|
EIP Logs
|
|
|
|
EIP Charts
|
 |
|
|
EIP Sessions for User
|
|
|
|
EIP Sessions for User IP Address
|
|
|
|
EIP Sessions for Profile
|
|
|
|
EIP Sessions for Rule
|
|
|


Exception Traffic Log Screens
For Releases 22.1.2 and later.
| Chart, Map, or Table Title | Thumbnail | Navigation to Chart, Map, or Table |
|---|---|---|
|
Exception Traffic Logs
|
|
|
Firewall Log Screens
| Chart, Map, or Table Title | Thumbnail | Navigation to Chart, Map, or Table |
|---|---|---|
|
Firewall Access Logs
|
|
|
|
Firewall Access Log Charts
(For Releases 21.2 and earlier.)
|
|
|
|
Firewall Events for Application
|
|
|
|
Firewall Events for URL Category
|
|
|
|
Firewall Events for Firewall Rule
|
|
|
|
Firewall Events for Destination IP Address
|
|
|
|
Firewall Events for Source IP Address
|
|
|
|
Firewall Events for Network Protocol
|
|
|
|
Firewall Events for Session Duration
|
|
|
|
Firewall Events for Authorization Status (for Releases 22.1.1 and later)
|
|
|
|
Firewall Maps (for Releases 22.1.1 and later)
|
|


Guest VNF Events Log Screens
| Chart, Map, or Table Title | Thumbnail | Navigation to Chart, Map, or Table |
|---|---|---|
|
Guest VNF Logs
|
|
|

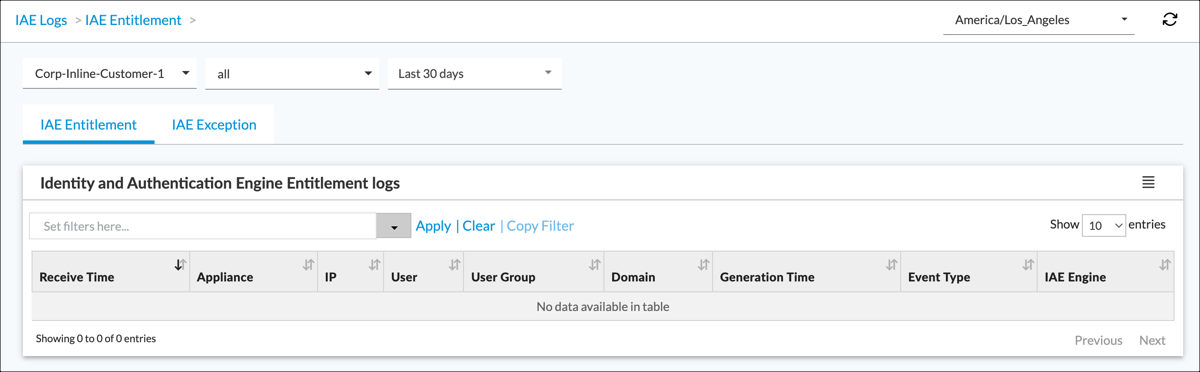
Identity and Authentication Entitlement Log Screens
For Releases 22.1.4 and later.
| Chart, Map, or Table Title | Thumbnail | Navigation to Chart, Map, or Table |
|---|---|---|
|
IAE Entitlement Logs
|
|
|
|
IAE Exception Logs
|
|
|

Packet Captures Log Screens
| Chart, Map, or Table Title | Thumbnail | Navigation to Chart, Map, or Table |
|---|---|---|
|
Packet Capture Logs
|
|
|

SASE Web Monitoring Log Screens
For Releases 22.1.1 and later.
| Chart, Map, or Table Title | Thumbnail | Navigation to Chart,Table, or Map |
|---|---|---|
|
SASE Web-Monitoring Logs
|
|
|
|
SASE Web-Monitoring Charts
|
|
|
|
SASE Web-Monitoring Logs for URL Category
|
|
|
|
SASE Web-Monitoring Logs for Application
|
|
|
|
SASE Web-Monitoring Logs For Application Category
|
|
|
|
SASE Web-Monitoring Logs For Web-Messaging Protocol
|
|


SD-LAN Log Screens
For Releases 22.1.1 and later.
|
SD-LAN Microsegmentation Logs
|
|
|
|
SD-LAN 802.1X Logs
|
|
|
|
SD-LAN IP Source Guard Logs
|
|
|
|
SD-LAN Bride Domain Interface Logs
|
|
|


SD-WAN Log Screens
| Chart, Map, or Table Title | Thumbnail | Navigation to Chart, Map, or Table |
|---|---|---|
|
SD-WAN Traffic Logs
|
 |
|
SSL Decryption Log Screens
| Chart, Map, or Table Title | Thumbnail | Navigation to Chart, Map, or Table |
|---|---|---|
|
SSL Decryption Logs
|
|
|

Threat Detection Log Screens
| Chart, Map, or Table Title | Thumbnail | Navigation to Chart, Map, or Table |
|---|---|---|
|
Antivirus Logs
|
 |
|
|
IDP Logs
|
|
|
|
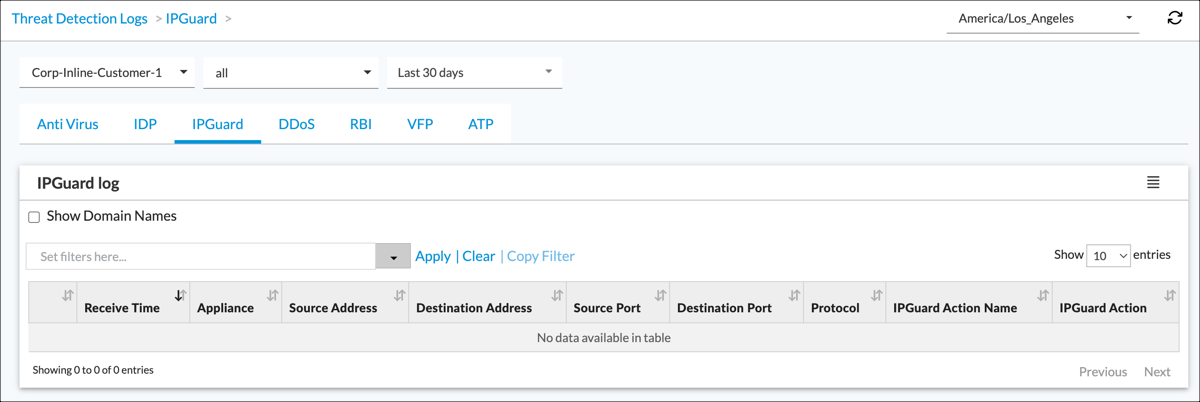
IP Guard Logs
|
|
|
|
DDoS Logs
|
 |
|
|
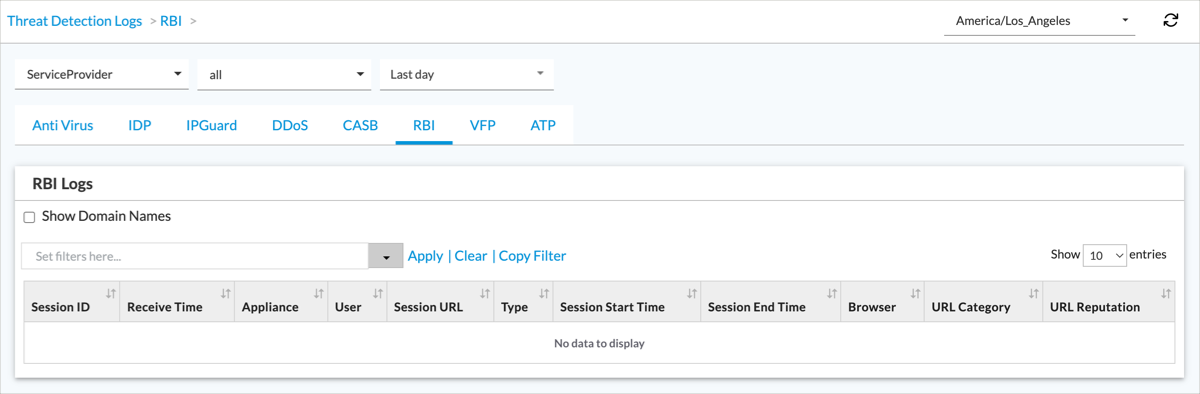
RBI Logs (for Releases 22.1.1 and later)
|
|
|
|
VFP Logs (for Releases 22.1.1 and later)
|
|
|
|
ATP Logs (for Releases 22.1.1 and later)
|
|
|


Threat-Filtering Log Screens
| Chart, Map, or Table Title | Thumbnail | Navigation to Chart, Map, or Table |
|---|---|---|
|
URL-Filtering Logs
|
|
|
|
IP-Filtering Logs
|
|
|
|
File-Filtering Logs
|
 |
|
|
DNS-Filtering Logs
|
 |
|


Traffic-Monitoring Log Screens
| Chart, Map, or Table Title | Thumbnail | Navigation to Chart, Map, or Table |
|---|---|---|
|
Traffic-Monitoring Logs
|
 |
|
|
Traffic-Monitoring Logs Charts
|
|
|
|
Traffic-Monitoring Events for Application
|
|
|
|
Traffic-Monitoring Events for Rule
|
|
|
|
Traffic-Monitoring Events for Network Protocol
|
 |
|
|
Traffic-Monitoring Events for Destination IP Address
|
 |
|
|
Traffic-Monitoring Events for Source IP Address
|
 |
|
|
Traffic-Monitoring Events for Session Duration
|
 |
|


Traffic-Steering Log Screens
| Chart, Map, or Table Title | Thumbnail | Navigation to Chart, Map, or Table |
|---|---|---|
|
Traffic-Steering Logs
|
 |
|
|
Traffic-Steering Log Charts
|
 |
|
VMS Private Mobility Log Screens
For Releases 21.2 and 22.1.1 through 22.1.3.
| Chart, Map, or Table Title | Thumbnail | Navigation to Chart, Map, or Table |
|---|---|---|
|
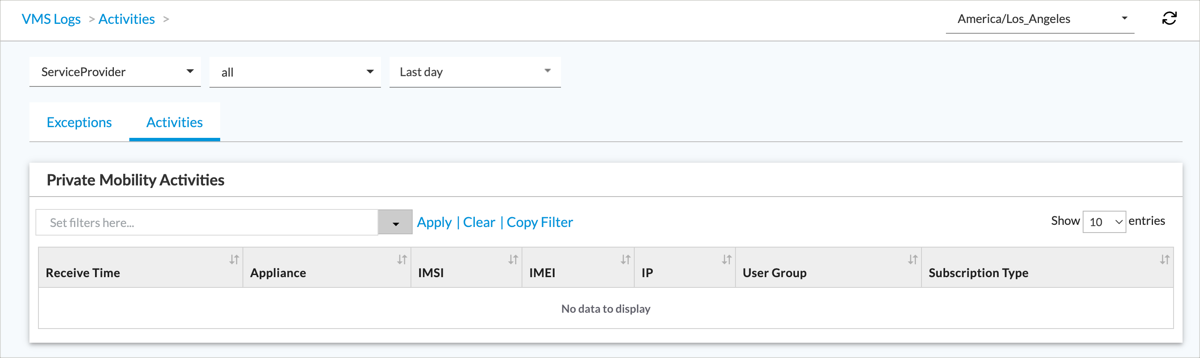
Private Mobility Activity Logs (for Releases 21.2 and 22.1.1 through 22.1.3)
|
|
|
|
Private Mobility Exception Logs (for Releases 21.2 and 22.1.1 through 22.1.3)
|
|
|

VMS SASE-for-SIM Log Screens
For Releases 22.1.4 and later.
| Chart, Map, or Table Title | Thumbnail | Navigation to Chart, Map, or Table |
|---|---|---|
|
SASE on SIM Activity Logs (for Releases 22.1.4 and later)
|
|
|
|
SASE on SIM Exception Logs (for Releases 22.1.4 and later)
|
|
|
Web-Monitoring Log Screens
| Chart, Map, or Table Title | Thumbnail | Navigation to Chart, Map, or Table |
|---|---|---|
|
HTTP Traffic-Monitoring Logs
|
 |
|
|
HTTP Traffic-Monitoring Log Charts
|
 |
|
|
HTTP Events for HTTP Host
|
 |
|
|
HTTP Events for Content Type
|
 |
|
|
HTTP Events for Operating System
|
 |
|
|
HTTP Events for Browser
|
|
|

Supported Software Information
Releases 20.2 and later support all content described in this article, except as noted in the tables