SD-WAN Dashboards
![]() For supported software information, click here.
For supported software information, click here.
Versa SD-WAN operates on Versa Operating SystemTM (VOSTM) devices, such as branches, hubs, and Controllers. These devices export logs with SD-WAN statistics to Analytics clusters, where they are used to generate charts, maps, and tables that you can view from dashboards in Versa Director.
This articles describes the SD-WAN dashboards, which are located at Analytics > Dashboards > SD-WAN. You can view the following SD-WAN dashboards:
- SD-WAN top level dashboard—Displays summary information for multiple VOS devices.
- Sites dashboard—Displays SD-WAN traffic usage for multiple VOS devices.
- Sites Map dashboard—Displays maps providing views for one or more VOS devices.
- Paths dashboard—Displays information about the paths between VOS devices.
- Device Details dashboard—Displays information about a single VOS device.
Note that the top level SD-WAN dashboard and SD-WAN Sites dashboards display information for groups of VOS devices only. You can view information for all devices or you can select a site tag to view information for the group of devices associated with the tag. Site tags are user-defined and appear in dashboard drop-down lists approximately 15 minutes after they are configured. For information about how to configure site tags, see Configure and Use Site Tags in View Analytics Dashboards and Log Screens.
For general information about how to use an Analytics dashboard, see View Analytics Dashboards and Log Screens.
Top-Level SD-WAN Dashboard
To view summary information for the VOS devices for an organization, select Analytics > Dashboards > SD-WAN, and then select the organization in the first drop-down list. By default, the dashboard displays information for all VOS devices. To view information for a subset of devices, select a site tag in the second drop-down list.
Note: If you select an individual VOS device in the second drop-down list, the display changes to the Device Details Dashboard; see Device Details Dashboard, below.
The top-level SD-WAN dashboard displays the following:
- Statistics summary for the selected tenant and devices
- Total Sites—Number of sites for the selected organization.
- Sites with Low Availability—Count of sites that record an availability lower than 50%, for the selected time period.
- Sites with Dataplane Downtime—Count of dataplane down sites for the selected time period. A site dataplane is marked as down when all the SLAs towards all remote sites are down. Note that when a branch has SLA up towards Controllers, but has SLA down towards all its remote sites, then the branch is considered down.
- Sites with Critical and Major Alarms—Count of sites with active critical or major alarms. This field is used to get a quick view of sites that have a problematic, ongoing condition.
- Sites with Disconnects—Count of sites with branch disconnects for the selected time period. A branch disconnect alarm is generated by the Controller when it loses all SLAs towards a site, so that the site is completely unreachable from the perspective of the Controller. Loss of reachability to a Controller is a critical event.
- Sites with Violations—Count of SLA datapath-down events and SLA violation events. Datapath-down events occur when SLA is not met for a path. SLA violation events occur when there is a SLA profile violation for a forwarding policy.
- Sites with Threats—Count of sites with security threats. Threats include IDP, antivirus, DDoS, URL-filtering, IP-filtering and file-filtering threats. Sites forward threat counts every five minutes. For Releases 22.1.4 and later, only sites with threat logs of critical severity are included in the count.
- Top Sites chart
- Top Access Circuits chart
- SD-WAN Site map—For more information about site maps, see Sites Map Dashboard, below.

In the statistics summary, click one of the statistics to view more details. For example, if you click Site with Dataplane Downtime, the Sites With Dataplane Connectivity Issues table displays.

Sites Dashboard
To view SD-WAN traffic usage for the VOS devices for a tenant, select Analytics > Dashboards > SD-WAN > Sites, and then select the tenant in the first drop-down list. By default, the dashboard displays information for all VOS devices. To view information for a subset of devices, select a site tag in the second drop-down list.
Note: If you select an individual VOS device in the second drop-down list, the display changes to the Device Details Dashboard; see Device Details Dashboard, below.
The SD-WAN Sites dashboard displays the following tabs:
- Usage
- Sites Availability
- HA Pair Sites Availability
- Link Availability
- Connections
- Heat Map
Sites Usage
To view usage information for the VOS devices for a tenant, select Analytics > Dashboard > SD-WAN > Sites > Usage, and then select the tenant in the first drop-down list. By default, the dashboard displays information for all VOS devices. To view information for a subset of devices, select a site tag in the second drop-down list.
The dashboard display the following information:
- Top Sites Usage Over Time chart
- Sites table

Sites Availability
To view availability information for the VOS devices for a tenant, select Analytics > Dashboard > SD-WAN > Sites > Availability, and then select the tenant in the first drop-down list. By default, the dashboard displays information for all VOS devices. To view information for a subset of devices, select a site tag in the second drop-down list.
Note: The Site Availability chart is based on hourly data. As a result, this chart displays 30 days of data by default, which is the default hourly retention time.
The Site Availability tab displays information about the reachability of VOS devices from the Controller node. A color-coded chart represents VOS device availability over time.
- Down (red)—If availability is <10% due to no SLA activity, or if SLA loss is > 98%, the link is in down state. For the most recent time, we wait for over 10 minutes of inactivity before marking the link as down.
- Degraded (orange)—If availability is ≥ 10% but < 95%. This state signifies brownout conditions detected by SLA loss values ≥ 50%.
- Up (green)—If availability is ≥ 95%.
- Indeterminable (gray)—This state is applicable when there is no SLA activity for a minimum of 5 minutes.

HA Pairs Sites Availability
(For Releases 22.1.3 and later.)
To view combined availability information of high availability (HA) device pairs for a tenant, select Analytics > Dashboard > SD-WAN > Sites > HA Pair Sites Availability, and then select the tenant in the first drop-down list.
The HA-Pair-Sites Availability chart merges availability data for sites containing an HA pair. The states Up, Degraded, Down, and Indeterminable apply to the site HA pair as follows:
- Up—The pair is available for a time period within the chart.
- Degraded—Either of the two devices is up, but one of them is degraded.
- Down—Both devices are down.
- Indeterminable—The status cannot be determined because no SLA activity is detected for 5 minutes or more.

Link Availability
To view link availability information for the VOS devices for a tenant, select Analytics > Dashboard > SD-WAN > Sites > Availability, and then select the tenant in the first drop-down list. By default, the dashboard displays information for all VOS devices. To view information for a subset of devices, select a site tag in the second drop-down list.
Note: The Link Availability chart is based on hourly data. As a result, this chart displays 30 days of data by default, which is the default hourly retention time.
The Link Availability chart displays information about the reachability of a link from the Controller node. A color-coded chart represents link availability over time.
- Down (red)—If availability is < 10% due to no SLA activity, or if SLA loss is > 98%, the link is in the down state. For the most recent time, we wait for over 10 minutes of inactivity before marking the link as down.
- Degraded (orange)—If availability is ≥ 10% but < 95%. This state signifies brownout conditions detected by SLA loss values ≥ 50%.
- Up (green)—If availability is ≥ 95%.
- Indeterminable (gray)—This state is applicable for most recent time when there is no SLA activity for the link for a minimum of 5 minutes.

Sites Connections
To view the top 50 site-to-site connections by number of sessions, select Analytics > Dashboard > SD-WAN > Sites > Connections. The dashboard displays the Top 50 Sites to Sites Connections chart, which displays the number of sessions between devices for the time period of the display.
To view the number of sessions between VOS devices, hover over the arc connecting the two devices. In the example below, there are 1,526,309 sessions between devices SanJose-Office-Preferred-Standby and Bangalore-ECT-DC-Active.

Sites Heat Map
To view a heat map of the VOS devices for a tenant, select Analytics > Dashboard > SD-WAN > Sites > HeatMap. The heat map displays information about the activity and availability of devices in a single view.
The size of a heatmap block is based on the number of sessions processed by the device, and the color of the block ranges from dark red (0 percent VOS device availability) to dark green (100 percent VOS device availability) for the selected time interval. Hover over a block to view availability and session statistics.

Sites Map Dashboard
To view a map of device locations, site availability, and traffic activity between sites. select Analytics > Dashboard > SD-WAN > Sites Map.
To change the type of data displayed on the map, select one of the following views from the drop-down list in the upper-right corner of the map:
- Network view—Displays sites using map pegs. Sites may contain multiple VOS devices.
- Traffic view—Displays traffic between sites. Sites are marked by site pegs, and connections are shown as dotted blue lines.
- Connectivity view—Displays SLA metrics related to connections between VOS devices. Connections are shown as dotted gray lines.
- Alarm Events view—Displays the number of alarms for sites on the map for the selected time period. Click a site to view a chart of alarm counts by type.
- Threat Events view—Displays the number of threat events for sites on the map for the selected time period. Click a site to view a chart of threat counts by type.
- Heat Map view—Displays a heat map for sites on the map. To change the heat map metric, select a metric from the drop-down list on the Map View drop-down list.
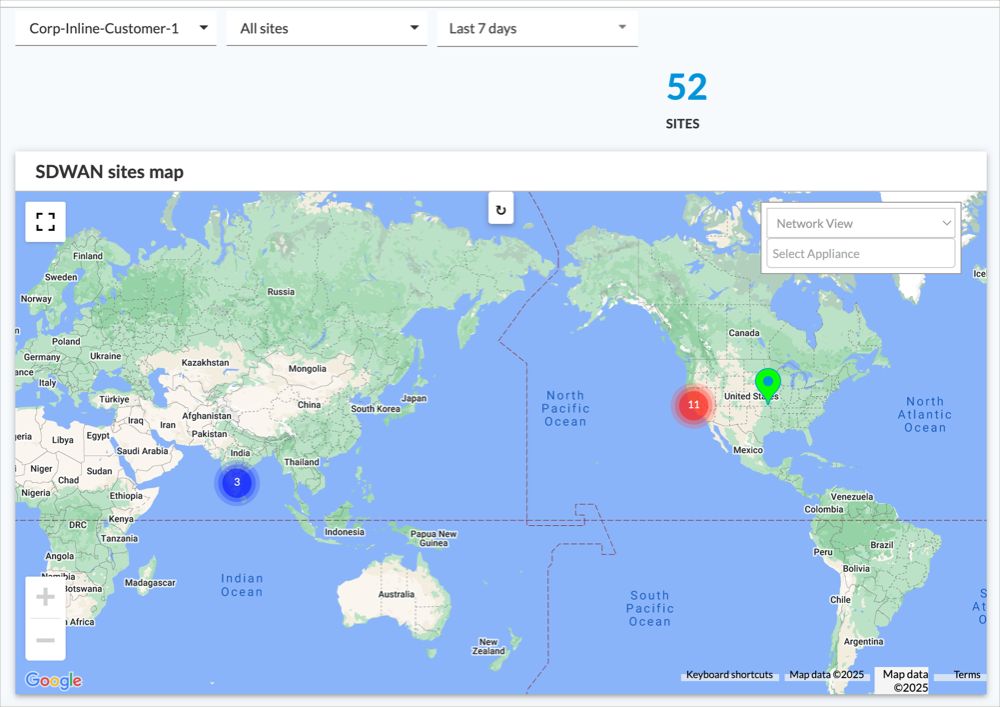
Click a numbered circle to zoom in on an area. The following example displays the result of clicking on the circle located in southern India.

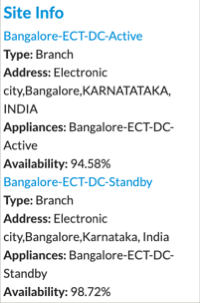
Click a site peg to view a popup card for the site. For each VOS device on the site, the popup card lists the device type, address, device name, and availability. The following example popup card displays details for site Bangalore-ECT-DC-Active.
Paths Dashboard
WAN links are often referred to as circuits. Circuits and paths are different. A circuit is a WAN endpoint on a VOS branch device, and a path runs end to end from a local branch to a remote branch, in the process traversing a local circuit (that is, a local WAN endpoint) and a remote circuit (a remote WAN endpoint).
For example, suppose Branch-1 and Branch-2 each have two WAN circuits, called Internet-1 and Internet-2. These circuits allow for four paths between Branch-1 and Branch-2:
- Branch-1–Internet-1 → Branch-2–Internet-1
- Branch-1–Internet-1 → Branch-2–Internet-2
- Branch-1–Internet-2 → Branch-2–Internet-1
- Branch-1–Internet-2 → Branch-2–Internet-2
To view information about paths between VOS devices, select Analytics > Dashboard > SD-WAN > Paths. Then, in the second drop-down list, select a device at one end of a path, referred to as the from-site. By default, paths between the from-site and all other VOS devices are displayed. You can select a device from the third drop-down list to view only the paths to a single device. This device is referred to as the to-site.
The following example displays the drop-down lists for the dashboard at Analytics > Dashboard > SD-WAN > Paths. In the second drop-down list, the from-site is Azure-WestUS-VGW-01. In the third drop-down list, no to-site has been selected. This dashboard displays paths between VOS device Azure-WestUS-VGW-01 and all other VOS devices to which the device has formed paths.

The SD-WAN Paths dashboard displays the following tabs in the horizontal menu bar:
- Usage
- SLA Metrics
- Rules
- MOS
- QoS
- QoE
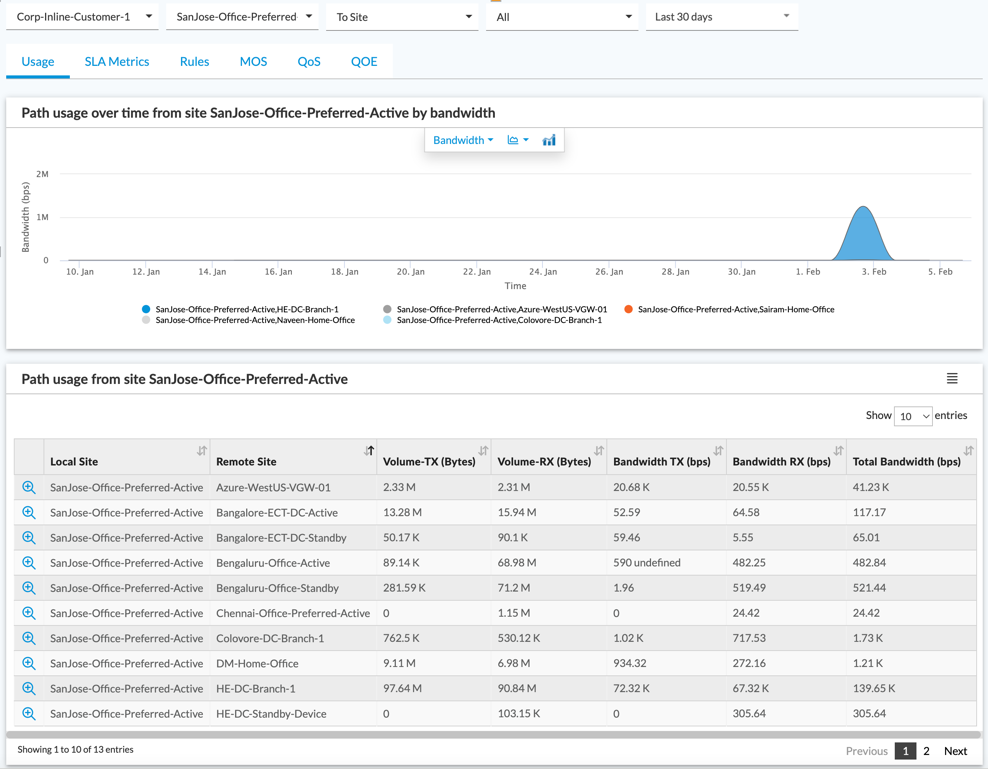
Path Usage
To view information about path usage between VOS devices, select Analytics > Dashboard > SD-WAN > Paths > Usage, and then select a from-site in the second drop-down list.
The Usage dashboard displays the following information:
- Path Usage over Time from Site from-site
- Path Usage from Site from-site
Path SLA Metrics
To view SLA metrics for paths between VOS devices, select Analytics > Dashboard > SD-WAN > Paths > Usage, and then select the from-site in the third drop-down list.
The SLA dashboard for paths displays the following information:
- SLA Metrics over Time from Site from-site
- SLA Metrics from Site from-site

You can view SLA metrics for traffic on a path between the from-site and a to-site for a specific forwarding class and pair of circuits. To do this click the Zoom icon for a row in the SLA Metrics from Site from-site table. Note that each row includes circuit names (Local Access Circuit, Remote Access Circuit), forwarding class (Forwarding Class), and to-site (Remote Site.) The screen displays the following items:
- SLA Delay Metrics from from-site (circuit-name-1) to to-site (circuit-name-2) — forwarding-class
- SLA Loss Ratio Metrics from from-site (circuit-name-1) to to-site (circuit-name-2) — forwarding-class
- SLA Logs from from-site (circuit-name-1) to to-site (circuit-name-2) — forwarding-class

Path Rules
To view metrics for rules applied to paths between VOS devices, select Analytics > Dashboard > SD-WAN > Paths > Usage, and then select the from-site in the third drop-down list.
The Rules dashboard displays the following information:
- Top Rules from Site from-site
- Rules from Site from-site

To view rule statistics for paths between the from-site and another site, select the Zoom icon on a row in the Rules from Site site table. The screen displays the following information:
- Rule rule-name Usage For Traffic Flowing from Site from-site to Site to-site
- SLA Violation Seen by Rule rule-name over Time from Site from-site to Site to-site
- SLA Alarms

Path MOS Score
To view information about the mean opinion score (MOS) for paths between VOS devices, select Analytics > Dashboard > SD-WAN > Paths > Usage, and then select the from-site in the third drop-down list.
The MOS dashboard displays the following information:
- Top MOS Score chart
- MOS Score table

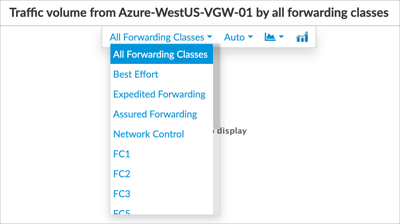
Path QoS
To view information about the quality of service (QoS) for paths between VOS devices, select Analytics > Dashboard > SD-WAN > Paths > Usage, and then select the from-site in the third drop-down list.
Charts distinguish between forwarding classes numbered zero (FC0) through fifteen (FC15). These classes are grouped together into the following categories:
- Network Control—Forwarding Class 0 through Forwarding Class 3
- Expedited—Forwarding Class 4 through Forwarding Class 7
- Assured—Forwarding Class 8 through Forwarding Class 11
- Best Effort—Forwarding Class 12 through Forwarding Class 15
The QoS dashboard displays the following information:
- Traffic Volume from from-site
- Traffic Bandwidth from from-site
- Volume Dropped from from-site
- Path QoS of from-site

For each QoS chart, you can limit the display by selecting a forwarding class or forwarding class category from the drop-down list included in the chart.
Path QoE
To view information about users' quality of experience (QoE) for paths between VOS devices, select Analytics > Dashboard > SD-WAN > Paths > Usage, and then select the from-site in the third drop-down list.
The QoE dashboard displays the following charts:
- Quality of Experience per Path
- Quality of Experience After SD-WAN Optimization
QoE statistics are based on packet loss, and charts are color coded as follows:
- Red (poor)—Packet loss of greater than or equal to 5%,
- Yellow (fair)—Packet loss between 1% and 5%.
- Green (good)—Packet loss of less than 1%.

Device Details Dashboard
The device details dashboard displays status and traffic information for a single VOS device. To access the device details dashboard, use one of the following methods:
- Select Analytics > Dashboard > SD-WAN > Sites, and then select a VOS device from the second drop-down list.
- From the Heat Map chart on Analytics > Dashboard > SD-WAN > Sites > Heat Map, click on a VOS device.
- From the Sites map on Analytics > Dashboard > SD-WAN > Sites Map, click on a VOS device.
- From the Sites table on Analytics > Dashboard > SD-WAN > Sites > Usage, click on a VOS device in the Sites table.
The following example displays the device details dashboard for VOS device Bangalore-ECT-DC-Active:
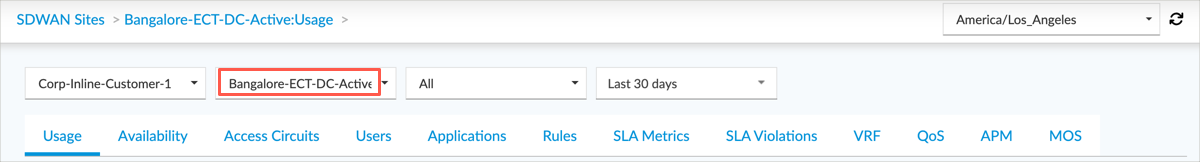
The device details dashboard has the following tabs in the horizontal menu bar:
- Usage
- Availability
- Access Circuits
- Users
- Applications
- Rules
- SLA Metrics
- SLA Violations
- VRF
- QoS
- APM
- MOS
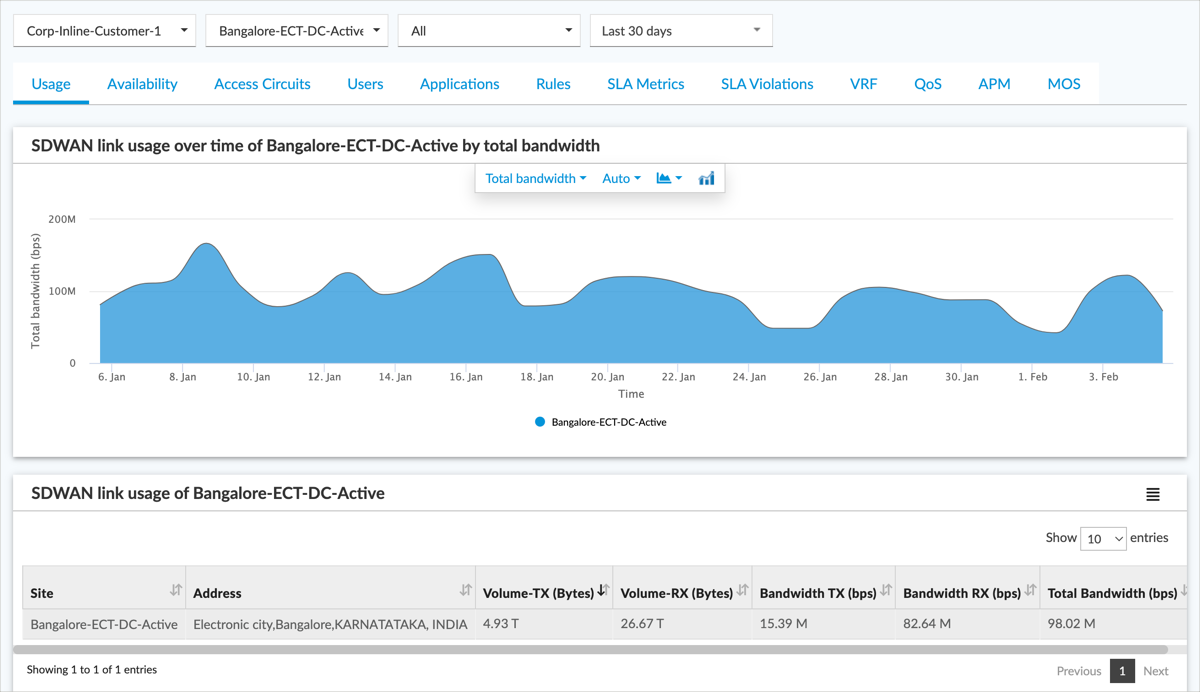
Device Usage
To view overall SD-WAN traffic statistics for a VOS device, select Analytics > Dashboard > SD-WAN > Sites. Select a VOS device from the second drop-down list, and then select the Usage tab.
The usage dashboard displays the following charts:
- SD-WAN Link Usage over Time of device
- SD-WAN Link Usage of device
Device Availability
To view availability statistics for a VOS device, select Analytics > Dashboard > SD-WAN > Sites. Select a VOS device from the second drop-down list, and then select the Availability tab.
The Availability dashboard displays the following information:
- Total Availability of device
- Availability over Time of device —Reflects the SD-WAN site's reachability to Controllers. The device availability state is calculated every 5 minutes based on SLA path metrics between the sites and Controllers, as well as log activity from the site.
- Down—Availability is less than 10%. This state indicates either no activity from the site or SLA loss > 98%. For the most recent time displayed on the chart, there must be at least 10 minutes of inactivity before the link is marked as down.
- Degraded—If availability is ≥ 10% but < 95%. This state signifies brownout conditions detected by SLA loss values ≥ 50%. If link availability is greater than or equal to 10% but less than 95%, the links is marked as degraded. This state signifies brownout conditions detected by SLA loss values of greater than or equal to 50%.
- Up—Device availability is greater than or equal to 95%.
- Indeterminable—Applicable for most recent time when there is no activity for a minimum of 5 minutes.
Note: Overall site availability percentage is impacted only if the site is in down state during any 5-minute period. It is not affected by the degraded state, as there is still some activity from the site during this time.
- Service Uptime of device
- Data Plane Connectivity over Time of device—Reflects the SD-WAN site's reachability to any remote sites or hubs (excluding controllers) through WAN links. Dataplane states of down, degraded, and up are determined for each time block based on the downtime data, measured in seconds, that is periodically sent from the site.
The downtime percentage for a time block is calculated using the following formula:
Downtime-percentage = Downtime-in-seconds / Total-seconds
Dataplane states are based on the following:- Down—Downtime percentage is greater than 98%
- Degraded—Downtime percentage is greater than 2% and less than or equal to 98%
- Up—Downtime percentage is less than 2%
- Indeterminable—Applicable for any 5-minute time block with no data.
Note: Overall availability calculations use only the available data. Time blocks with no data due to control plane reachability issues are excluded from the computation.
- Connectivity Statistics of device
- Link Availability of device—Health of the VOS device WAN link's reachability to remote sites. Link availability states are based on the following:
- Down—If link availability is less than 10% due to no SLA activity or if SLA loss is less than 98%, the link is marked as down. For the most recent time displayed on the chart, the VOS device waits for at least 10 minutes of inactivity before marking the link as down.
- Degraded—If link availability is greater than or equal to 10% but less than 95%, the links is marked as degraded. This state signifies brownout conditions detected by SLA loss values of greater than or equal to 50%.
- Up—When link availability is greater than or equal to 95%, the link is marked as up.
- Indeterminable—Applicable for most recent time when there is no SLA activity for the link for a minimum of 5 minutes.
Note: Overall link availability percentage is impacted only when the link is in a down state during any 5-minute period.
- Site device Status Log table

To view downtime details, in the Connectivity Statistics of device table, click a VOS device. The screen displays the following charts:
- device by Datapath Downtime
- device by Remote Sites Up/Down
- device by Paths Up/Down

Access Circuits
To view traffic usage for each WAN link for a VOS device, select Analytics > Dashboard > SD-WAN > Sites. Select a VOS device from the second drop-down list, and then select the Access Circuits tab.
VOS keeps track of traffic transmitted (Tx) and received (Rx) and exports it to Analytics every 5 minutes. This provides the ability to measure average bandwidth consumed by WAN links without exporting these statistics every minute.
For Releases 22.1.4 and later, VOS generates and exports statistics for peak Tx/Rx bandwidth consumed at 5 minute intervals.
The Access Circuits dashboard displays the following information:
- SD-WAN Overall Usage over Time of device—By default, this chart uses the Total Bandwidth metric. To view a specific metric, select one of the following from the drop-down list in the chart:
- Total Bandwidth
- Bandwidth Tx Rx
- Peak Bandwidth—Releases 22.1.4 (Service Release dated February 8, 2025) and later.
- Peak Bandwidth Tx Rx—Releases 22.1.4 (Service Release dated February 8, 2025) and later.
- Volume Rx
- Volume Tx
- Volume Tx Rx
- SD-WAN Overall Traffic Usage of device
- SD-WAN Application Traffic Usage over Time of device
- DIA Application Traffic Usage over Time of device
- SD-WAN Application Traffic Usage Summary of device
- DIA Application Traffic Usage Summary of device

Users
To view user statistics for a VOS device, select Analytics > Dashboard > SD-WAN > Sites. Select a VOS device from the second drop-down list, and then select the Users tab.
The Users dashboard displays the top traffic sources for a VOS device. If there is an active directory or any other user identification schemes configured on the VOS device, the username is displayed. Otherwise, the source IP address is used to identify users.
The Users dashboard displays the following information:
- Top Users of device
- Top Users Per Access Circuit over Time for device
- Users Usage

To view traffic information for a user of the device, in the Users Usage table, select the Zoom icon in the row for the user.
The following charts display:
- Top Applications of User user of device
- Top Destination Network Prefixes of User user of device
- Usage over Time of User user of device
- Applications of User user of device

Applications
To view application statistics for a VOS device, select Analytics > Dashboard > SD-WAN > Sites. Select a VOS device from the second drop-down list, and then select the Availability tab.
The Applications dashboard displays application information for the selected VOS device. The Applications dashboard displays the following items:
- Top Applications of device
- Categories of device
- Business Tags of device
- Top Application Per Access Circuit Usage over Time of device
- Application Usage of device

To view details for an application, in the Application Usage of device table, select the Zoom icon to view detailed statistics about the application listed in the row.

Rules
To view SD-WAN rules statistics for a VOS device, select Analytics > Dashboard > SD-WAN > Sites. Select a VOS device from the second drop-down list, and then select the Rules tab.
The Rules dashboard displays traffic-steering rule usage and violations for SD-WAN and DIA traffic. Forwarding rules are configured on the SD-WAN branches to steer traffic matching the rules to different paths based on the SLA conformance on each of the paths.
The Rules dashboard displays the following subtabs:
- SD-WAN
- DIA
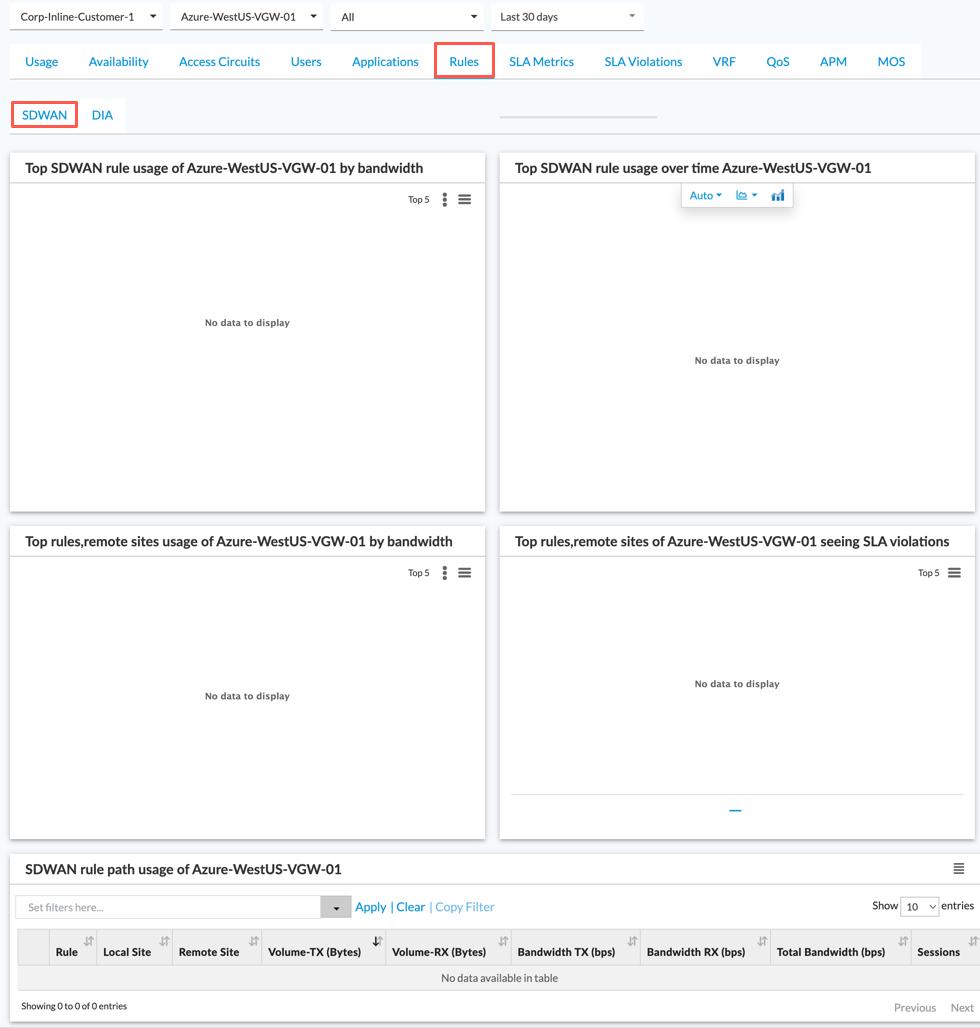
SD-WAN Rules Usage
To view rule information for SD-WAN traffic on a device, select the SD-WAN tab.
- Top SD-WAN Rule Usage of device
- Top SD-WAN Rule Usage over Time of device
- Top Rules, Remote Site Usage of device
- Top Rules, Remote Site Usage of device Seeing SLA Violations
- SD-WAN Rule Path Usage of device
DIA Rules Usage
To view rule information for DIA traffic on a device, select the DIA tab.
- Top DIA Rule Usage of device
- Top DIA Rule Usage over Time of device
- DIA Rule Usage of device

Device SLA Metrics
To view SLA metric statistics for a VOS device, select Analytics > Dashboard > SD-WAN > Sites. Select a VOS device from the second drop-down list, and then select the SLA Metrics tab. For more information about SLA metrics, see Configure SLA Monitoring for SD-WAN Traffic Steering.
The SLA Metrics dashboard displays the following items:
- Top SLA Measurement of device
- SLA Measurement of device—To view granular SLA metrics per path and traffic class, drill down on a VOS device name.

To view detailed information for a row in the SLA Measurement of device table, click the Zoom icon for the row. The screen displays the following items:
- SLA Delay Metrics from from-site (circuit 1) to to-site (circuit 2)
- SLA Loss Ratio Metrics from from-site (circuit 1) to to-site (circuit 2)
- SLA Logs from from-site (circuit 1) to to-site (circuit 2)

Device SLA Violations
To view SLA violation statistics for a VOS device, select Analytics > Dashboard > SD-WAN > Sites. Select a VOS device from the second drop-down list, and then select the SLA Violations tab.
The SLA Violations dashboard displays summary reports and SLA-related alarms. The charts on this dashboard provide aggregated statistics for SD-WAN path flaps and SLA violations events per path. If SD-WAN branches are configured to generate alarms for path disconnect and path SLA violation events, they are also displayed on this dashboard.
The SLA Violations dashboard displays the following charts:
- Top Remote Sites of device Seeing Path Flaps Based on SLA
- Top Remote Sites of device Seeing SLA Violations
- SLA Alarms of device

VRF
To view traffic usage per virtual routing and forwarding (VRF) instance for a VOS device, select Analytics > Dashboard > SD-WAN > Sites. Select a VOS device from the third drop-down list, and then select the VRF tab.
The VRF dashboard provides details on the VRF traffic sent and received on the WAN links for each LAN, including whether the traffic type is SD-WAN or DIA (native).
The VRF dashboard displays the following information:
- VRF Usage over Time of device
- VRF Usage of device

To view VNF information for a row in the VRF Usage of device table. click the zoom icon. The VRF Usage over Time chart displays for the values in the row.

Device QoS
To view device quality of service (QoS) statistics, select Analytics > Dashboard > SD-WAN > Sites. Select a VOS device from the second drop-down list, and then select the QoS tab.
The QoS dashboard displays traffic shaping reports for a VOS device's WAN links. If shaping is enabled on the WAN link, you can view the amount of sent and dropped traffic for each traffic class and for each WAN link. This information can help you to determine whether traffic oversubscription occurred.
The QoS dashboard displays the following information:
- Traffic Volume from device
- Traffic Bandwidth from device
- Volume Dropped at device
- QoS of device

Application Performance Metrics
The APM tab displays TCP application performance metrics (APM) for all TCP-based traffic. When you enable TCP performance monitoring on VOS devices running SD-WAN, statistics corresponding to TCP sessions are exported to Analytics nodes. The statistics are aggregated per tenant, appliance, application, source, destination prefix, and WAN link. The metrics include round-trip time, aborted and refused counts, session and packet counts, and retransmission counts. These metrics are used to calculate the quality of the application, which is called the Versa application rank. This rank is computed as a value from 1 through 100, where 1 is the best performing application and 100 is the worst.
For releases prior to Release 22.1.1, the APM tab displays TCP application performance information.
For Releases 22.1.1 and later, the APM dashboard displays tabs for passive APM and active APM. The Passive APM tab displays performance monitoring information for TCP applications. The Active APM tab displays performance monitoring information for SaaS applications. For information about passive APM, see Configure Application Performance Monitoring. For information about active APM, see Configure SaaS Application Monitoring.
Passive APM
For Releases 22.1.1 and later.
To view statistics for passive APM for a VOS device, select Analytics > Dashboard > SD-WAN > Sites. Select a VOS device from the second drop-down list, and then select APM > Passive APM.
The Passive APM tab displays the following information:
- Application Performance of device
- Application Performance over Time of device
- Application Performance Details of device

In the Application Performance Details of device table, click the ![]() Zoom icon to view passive APM details for an application. The screen displays the following information:
Zoom icon to view passive APM details for an application. The screen displays the following information:
- Top Destination (device, application)
- Top Sources (device, application)
- Top Remote Sites (device, application)
- Destination Metrics With Poor VLR (device, application)
- Remote Site Metrics With Poor VLR (device, application)
- Performance Monitoring (device, application)
For example, the following screen displays passive APM details for the ssl application for device Azure-WestUS-VGW-01.


Active APM
For Releases 22.1.1 and later.
The Active APM tab displays the following items:
- Active Application Monitoring over Time of device (chart)
- Active Application Monitoring Metrics of device (table)

APM
For Releases 21.2.3 and earlier.
The APM tab displays the following information:
- TCP Application Performance of device
- TCP Application Performance over Time of device
- TCP Application Performance of device —In this table, the Versa Application Rank column indicates the application's performance with a unitless numeric ranking and a color:
- Green
- Rank—0 through 33.3
- Performance—Good
- Yellow
- Rank—33.3 through 66.3
- Performance—Medium
- Red
- Rank—66.3 and higher
- Performance—Poor
- Green

MOS Tab
To view mean opinion score (MOS) information for a VOS device, select Analytics > Dashboard > SD-WAN > Sites. Select a VOS device from the second drop-down list, and then select the MOS tab.
The MOS dashboard displays the mean opinion score computed by having the VOS device perform passive monitoring of VoIP traffic. You can use MOS scores as an SLA metric in traffic steering policies.
The MOS dashboard displays the following information:
- MOS Scores of device
- Active Sessions Per MOS Ranges
- MOS Scores of device

Supported Software Information
Releases 21.2 and later support all content described in this article, except:
- Release 22.1.1 supports passive and active APM tabs.
- Release 22.1.4 dated February 8, 2025 adds support for peak metrics in the SD-WAN Overall Usage over Time of device chart.