View Analytics Dashboards and Log Screens
![]() For supported software information, click here.
For supported software information, click here.
Versa Operation SystemTM (VOSTM) branch and Controller devices collect log information about different types of data, such as branch availability, usage, and SLA metrics, and they send the logs to Analytics clusters. The Analytics clusters process the logs and store them as data in the Analytics datastores and as indexed logs in search engine datastores within the cluster. You can use the Versa Director GUI to display the stored data on dashboards and log screens. Dashboards present analyzed log data in the form of charts, tables, maps, and, for Releases 21.1.1 and later, statistics blocks. Log screens present log data in tables (of either individual logs or summarized logs) and charts summarizing the log data.
For Releases 22.1.2 and later, you can enable optimized dashboards to reduce dashboard load time for large sites. For Releases 22.1.1 and later, you can use RBAC resource tabs to restrict user access to only a subset of dashboards and log screens. For Releases 21.1.1 and later, you can configure site tags to view dashboards for a selected set of sites.
This article describes how to use the Analytics dashboard GUI to view the dashboard and log screens and how to customize the information presented on them. It also describes how to export charts and tables to a local system.
Dashboards
To access Analytics dashboards:
- For Releases 22.1.1 and later, select Analytics > Dashboard in the Director GUI.
- For Releases 21.2 and earlier, select Analytics > Dashboard (Home)
 > Dashboards.
Dashboards display charts, tables, maps, and statistics blocks and are organized into the following main categories:
- SD-WAN—Display secure SD-WAN topology, top sites usage, availability reports, traffic visibility reports, and SLA metrics.
- Security—Display NGFW information about applications, URLs, device identity, firewalls, and threat detection.
- Secure Access—Display Versa secure access summary statistics, user count distribution, usage per user, and registration statistics.
- System—Display appliance health, log activity, interfaces, guest VNFs, service node groups, and TWAMP information.
Log Screens
To access Analytics log screens:
- For Releases 22.1.1 and later, select Analytics > Logs in the Director GUI.
- For Releases 21.2 and earlier, select Analytics > Dashboard (Home) > Logs.
Log screens display tables and charts and include the following categories of logs:
- ADC
- Alarms
- Authentication
- Events
- Policies
- CGNAT
- DHCP
- DLP (for Releases 22.1.3 and later)
- DNS
- DNS filtering (for Releases 22.1.1 and later)
- DNS monitoring (for Releases 22.1.1 and later)
- DNS proxy
- DNS tunneling (for Releases 22.1.1 and later)
- EIP (for Releases 22.1.3 and later)
- Exception traffic (for Releases 22.1.2 and later)
- Firewall
- Guest VNF events
- Packet captures
- SASE web monitoring (for Releases 22.1 and later)
- SD-LAN (for Releases 22.1.4 and later)
- Bridge domain
- Dot1x
- IP source guard
- Microsegmentation
- SD-WAN
- SSL decryption
- Threat detection
- Antivirus
- ATP (for Releases 22.1 and later)
- CASB (for Releases 22.1.3 and later)
- DDoS
- IDP
- IP guard
- RBI (for Releases 22.1.1 and later)
- Threat filtering
- CASB (for Releases 22.1.3 and later)
- DNS filtering
- File filtering
- IP filtering
- URL filtering
- Threat intelligence
- Traffic monitoring
- Traffic steering
- VMS (for Releases 21.2.1 and later)
- Web monitoring
All charts, tables, maps, and statistics blocks are based on information currently stored in Analytics cluster datastores. Analytics clusters automatically delete expired data from their datastores. To access expired information, you can restore logs from the log archive. For information about restoring archived logs, see Manage Versa Analytics Log Archives.
Enable Optimized Dashboards
For Releases 22.1.2 and later.
You can use optimized dashboards to reduce the time required to load dashboards in large, scaled environments. Optimized dashboards suppress the display of some dashboard reports that use many resources. To generate these reports, use the reporting tool instead; see Manage Custom Reports.
To enable optimized dashboards:
- In Director view, select the Analytics tab.
- Select Administration > Configuration > Settings from the left menu bar. The following screen displays.

- Click Enable Optimized Dashboard.
- Click Save.
Modify Dashboard and Log Screen Display Parameters
Dashboard and log screen charts, tables, maps, and statistics blocks display information for a single tenant, for a selected time period, and for one or more sites. For all dashboards and log screens except Analytics SD-WAN dashboards, you can change display parameters in the drop-down menus shown in the following screenshot and described in the following table.

| Drop-Down Menu | Description |
|---|---|
| Tenant |
Select a tenant. |
| VOS Device |
Select a single VOS device or all VOS devices for the data to include in the dashboard or log screen. For Releases 21.1.1 and later, for certain dashboards, you can also select a site tag. Site tags identify groups of VOS devices. For more information, see Configure and Use Site Tags, below. Default: All |
| Time Period |
Select the time period of the data to include in the dashboard or statistics block. You can choose a standard time period or a custom one. All time periods are relative to the current time. All nodes in the Analytics cluster must be configured to use NTP to synchronize their times to ensure accuracy for the selected time period. The following are the standard time periods:
You can define a custom range of minutes, hours, days, weeks, or months, and you can define a date and time range. Default: Last day |
For SD-WAN dashboards, when you select an individual VOS device, the screen adds the Circuit drop-down menu, allowing you to select the circuit or circuits on the VOS device, as shown in the following screenshot.

The SD-WAN > Paths dashboard displays the From Site and To Site drop-down menus, allowing you to select a path between sites, as shown in the following screenshot.

View and Export Charts
Dashboard and log screen charts graphically represent the information that is in an Analytics datastore table. Many charts are generated based on a metric, which is a numeric field contained in the table. For example, the Analytics SD-WAN dashboard includes the Top Access Circuits chart. This chart can display the most heavily used access circuits based on the following metrics: bandwidth, volume of received traffic, volume of transmitted traffic, and a combination of the received and transmitted traffic volume. The following screenshot shows an example of the chart when you select the received volume metric, Volume Rx, and chart style Bar.

On some charts, you can select the chart metric, chart style, trend analysis line, and number of top entries to display. You can download and print any chart.
A chart menu in the upper-right corner of each chart includes one or more of the following options:
- Top
 —For charts that display a top count for the metric, click to include the top 5, 10, 15, or 20 entries in the chart.
 - Metric
 —Click to select the metric field to display the chart. Note that metric option Volume Tx Rx indicates two metrics, Volume Tx and Volume Rx, and does not apply to pie charts, which can display only a single metric.
 - Chart Style
 —Click to select a chart style. Chart styles include pie, area, bar, column, line, pie, scatter plot, and stacked bar. For chart styles that include a color-coded legend, you can click the items in the legend to toggle their inclusion in or exclusion from the chart.
 - Trend Analysis
 —Click to add a trend analysis line to the chart.
 - Download or Full Screen
 —Click to display the chart in full screen mode, print the chart, or download the chart in PNG, JPEG, or SVG format.
Configure and Use RBAC Resource Tags
For Releases 22.1.1 and later.
In Versa Director, you can associate one or more labels, called resource tags, with a VOS device. You then use the resource tags to restrict user accounts so that they can view only specific devices on Director and Analytics nodes.
To configure resource tags for a VOS device, in Director view select the Administration tab in the top menu bar, and then select Appliances in the left menu bar.

Click the ![]() Filter Column icon, and then click the Resource Tags box. The Resource Tags column displays in the table in the main pane.
Filter Column icon, and then click the Resource Tags box. The Resource Tags column displays in the table in the main pane.
In the Resource Tags column, click the Edit icon in the row containing the VOS device. The Edit Tags popup window displays.

In the Tags field, enter a list of resource tags, pressing the Enter key between each tag. Tags are automatically converted to icons as you press Enter. Click OK to save the tags. In the example above, resource tags Branch and Branch1 are associated with VOS device SDWAN-Branch1.
To associate the resource tag with a role, in Director view select Administration > Director User Management > Resource Tags > Tenant Resource Tags, and then click the + Add icon in the main pane.

Select a role from in the Role Name field, and then enter a list of resource tags in the Tags field. Click OK.
To associate the role with a user account, select Administration > Director User Management > Organization Users, and then in the main pane select a user account. The Edit Organization User popup window displays.

Select the role you associated with the resource tag. In the example above, user Branch1User is assigned role Branch1Role. This role is associated with resource tag Branch1 which is associated with VOS device SDWAN-Branch1.
Note: Director nodes and Analytics clusters periodically synchronize resource tags, by default every 15 minutes. As a result, it can take up to 15 minutes before resource tags are available for Analytics dashboards. For information about modifying the synchronization& interval, see Manage Analytics Synchronization.
When a user logs in and accesses the Analytics tab, only data related to VOS devices associated with the resource tag display.

Configure and Use Site Tags
For Releases 21.1.1 and later.
In Versa Director, you can associate one or more labels, called site tags, with a VOS device. You configure the site tags to identify groups of VOS devices, and then you select the tags in the SD-WAN and SD-WAN > Maps dashboards to display a consolidated view of all devices labeled with the tag.
To configure site tags:
- In Director view, select the Administration tab in the top menu bar.
- Select Appliances in the left menu bar. The following screen displays.

- In the Tags column in the main pane, click the
 Edit icon in the row containing the device. The Edit Tags popup window displays.

- In the Tags field, enter a comma-separated list of tags. Tags cannot contain spaces. Tags are automatically converted to icons as you enter each comma.

- Click OK.
Note: Director nodes and Analytics clusters periodically synchronize site tags, by default every 15 minutes. As a result, it can take up to 15 minutes before site tags are available for Analytics dashboards. For information about modifying the synchronization interval, see Manage Analytics Synchronization.
To use a site tag:
- In Director view, select the Analytics tab in the top menu bar.
- For Releases 22.1.1 and later, select Dashboard > SD-WAN in the left menu bar. For Releases 21.2 and earlier, select Dashboard (Home)
 > Dashboards > SD-WAN.
 - In the Sites drop-down menu, select a site tag.

The charts, maps, and statistics blocks on the dashboard then display consolidated information for all sites associated with the site tag. For example, the following screenshot shows the consolidated information for all sites marked with the Branch tag.

View and Export Tables
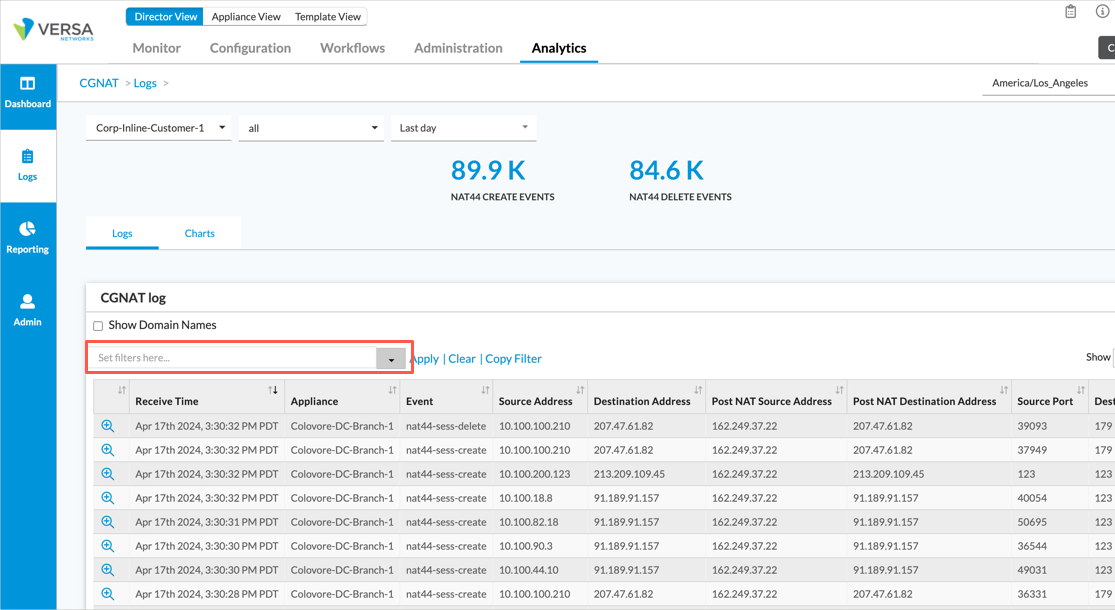
Many dashboards and log screens include tables that can be sorted, downloaded, and copied to a local clipboard. For log tables, you can also apply filters. For the packet capture log table, you can export to a packet capture (pcap) file. The following example screenshot displays the Logs > CGNAT table.

To sort the data in a table column, click the column heading. Click the column heading again to sort in reverse order.
For Releases 22.1.1 and later, select the ![]() hamburger menu to perform the following actions. For Releases 21.2 and earlier, use the buttons in the upper-right corner of the table:
hamburger menu to perform the following actions. For Releases 21.2 and earlier, use the buttons in the upper-right corner of the table:
- Copy—Copy the table to the clipboard on your local system.
- CSV—Download the table data in CSV format to a file on the local system. Each CSV entry is in the sort order that you see on the screen.
- PDF—Download the table data to a PDF file on the local system. The data is downloaded in the sort order that you see on the screen.
Filter a Log Table
For log tables, you can specify a filter to limit the table to only records that match search criteria.
For Releases 22.1.1 and later, to apply a filter in any log table:
- In Director view, select Analytics > Logs, and then select a log type from the vertical menu bar. For DNS, threat detection, and threat filtering logs, also select the tab for the log subcategory, such as DNS Proxy logs. The log screen for the log type displays.
- Click the Search box to activate it. When activated, the Search box displays in blue.

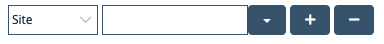
- Click the down arrow on the right-hand side of the Search box, and then click Add/Edit filter. The Filter popup window displays one of the following two search criteria menu bars.


- Use the menu bar to create a search criteria. For information about creating search criteria, see Enter Search Criteria, below.
- To add additional criteria, click the + Plus icon.
- If you enter multiple criteria for the same field, the filter applies OR logic when searching on that field.
- If you enter multiple criteria for different fields, the filter applies AND logic when searching through the logs.
- If you combine criteria for the same field and for different fields, the same-field criteria are applied first, and then different-field criteria are applied to the result.
- Click OK.
For Releases 21.2 and earlier, to apply a filter in any log table:
- In Director view, select Analytics > Dashboard (Home) > Logs.
- Select a log type from the left menu bar. The log screen for the log type displays.

- Click the Search box. The Filter popup window displays one of the following two search criteria menu bars.

.png?revision=1)
- Use the menu bar to create a search criteria. For information about entering search criteria, see Enter Search Criteria, below.
- To add additional criteria, click the
 Plus icon.
- If you enter multiple criteria for the same field, the filter applies OR logic when searching on that field.
- If you enter multiple criteria for different fields, the filter applies AND logic when searching through the logs.
- If you combine criteria for the same field and for different fields, the same-field criteria are applied first, and then different-field criteria are applied to the result.
- Click OK.
Enter Search Criteria
The following are the rules for entering search criteria for table filters:
- Select a field from the drop-down menu, and then enter a pattern that matches the entire field. Patterns are case-sensitive. If the menu bar contains the "is equal to" drop-down menu, select "is equal to".
For example, when searching DNS Proxy logs, to display entries with source address 10.42.146.160, select the Source Address field and enter the pattern 10.42.146.160.

The following screenshot shows an example of the records displayed based on this filter:

- Do not enter a partial pattern.
For example, to display entries whose source address contains the number 2, you cannot enter the pattern 2.

The following screenshot shows an example of the records displayed based on this filter:

- To match any number of characters in a pattern, use the asterisk (*) as a wildcard character. You cannot use the asterisk wildcard for fields containing port numbers.
For example, when searching DNS Proxy logs, to display entries with domain names beginning with americas, select the Domain field and enter the pattern as americas*.
The following screenshot shows an example of the records displayed based on this filter:

- If the menu bar contains the "is equal to" drop-down menu, you can select "is not equal to" to display rows that do not match the pattern.
View the Packet Capture Log Table
When you configure packet capture, you can view the capture packet logs in the Analytics GUI. For information about configuring packet capture, see Configure Packet Capture Logging in Apply Log Export Functionality.
To view packet capture logs:
- In Director view, select the Analytics tab in the top menu bar.
- For Releases 22.1.1 and later, select Logs > Packet Captures in the left menu bar. For Releases 21.2 and earlier, select Dashboard (Home) > Logs > Packet Captures. The main pane displays the Packet Captures table.

The Packet Captures table contains the following fields.
Field Description Download Download the log entry to the local system:
- Click the
 Pcap icon to download the log entry in pcap format. Ensure that a network protocol analyzer, such as Wireshark, is installed on the device on which the browser is running so that you view the packet capture in pcap format.
 - Click the
 Text icon to download the log entry in text format.
Receive Time Time when the VOS device received the packet. Appliance Name of the VOS device that received the packet. Source Address Source IP address of the packet. Destination Address Destination IP address of the packet. Source Port TCP or UDP source port number of the packet. Destination Port TCP or UDP destination port number of the packet Protocol Protocol used to send the packet:
- TCP
- UDP
Egress Interface Name of the interface on which the packet was sent. Ingress Interface Name of the interface on which the packet was received. From Zone Name of network interface security zone in which the packet was received. For more information, see Configure Zones and Zone Protection Profiles. To Zone Name of network interface security zone to which the packet was sent. Source Country Country from which the packet was sent. Destination Country Country to which the packet was sent. Module ID Module identifier. This value is always Log Export Functionality (LEF). Capture Mode Capture mode. This value is always Packet Capture. - Click the
- To display domain names instead of IP addresses, click Show Domain Names. You can display domain names only when DNS is enabled on the Analytics node.
- To display logs related to an entry, click the
 Details icon at the beginning of an entry. The Related Logs screen displays.

Software Release Information
Releases 20.2 and later support all content described in this article, except:
- Release 21.1.1 adds support for dashboard site tags and inclusion of statistics blocks in some dashboards.
- Release 21.2.1 adds support for VMS log screens.
- Release 22.1.1 adds support for RBAC resource tags, and for the following log screens: ATP, DNS tunneling, DNS monitoring, DNS filtering, and RBI.
- Release 22.1.2 adds support for exception traffic log screens and optimized dashboards.
- Release 22.1.3 adds support for the following log screens: CASB, DLP, and EIP.
- Release 22.1.4 renames the SD-WAN Sites with Threats statistics tile to be Sites with Security Incidents; support is added for SD-LAN logs.