Manage Custom Reports
![]() For supported software information, click here.
For supported software information, click here.
The Analytics nodes in an Analytics cluster collect data from SD-WAN Versa Operating SystemTM (VOSTM) devices and store it in datastores. You can generate custom reports from the datastores, which are stored in the database in the Analytics cluster.
Custom reports allow you to choose the charts, chart formats, tables, appliances, and time periods that you want to include. They can be generated automatically at preset times and can be downloaded to a local system and emailed to administrators automatically.
This article describes how to manage custom reports.
In addition to custom reports, Versa Analytics includes a number of predefined reports, referred to as business reports. For information about generating business reports, see Manage Business Reports.
Custom Reports
To use custom reports, you first build a custom template. The template defines which charts and tables to include in the report.
You can generate a template using the following methods:
- Versa Report Template Wizard—(For Releases 23.1.1 and later.) A workflow guides you through the template generation process.
- Manual Template Builder—You use a set of drop-down lists to build a report template. You can edit existing templates from the manual template builder only.
If your topology includes Analytics aggregator nodes that combine data from multiple Analytics clusters, you can select one of these nodes to create templates for reports with combined data. For more information about aggregator nodes, see Configure Analytics Aggregator Nodes.
Chart and Table Components
When you build a report template, you define the charts and tables to include in the template. For each chart or table, you define the components listed below.
Service Type
The service defines the type of information to report about. You can select from the following service types:
- SD-WAN—SD-WAN information such as site usage, service-level agreement (SLA), and quality of experience (QoE).
- Secure Access—Secure access information such as user statistics and failed and successful access attempts.
- Security—Security information such as top applications, top threats, and top URLs.
- Carrier-Grade NAT—NAT information such as top post-NAT source IP addresses, top destination and source addresses, and CGNAT logs.
- Traffic Monitoring—Traffic monitoring information such as top applications, top HTTP hosts, and traffic monitoring logs.
- System—VOS device information such as device alarms logs, appliance monitoring, and WAN interface utilization.
- Cloud API Security—(For Releases 23.1.1 and later.) API security information for infrastructure as a service (IaaS) and software as a service (SaaS) applications.
Report Type
The report type defines the type of data to include in the charts and tables in a report. Each report type corresponds to a database table in the Analytics database or search engine datastore, both referred to as datastores. The entries in the datastore table are identified by a set of one or more fields. The set of fields is called the report type key, or simply the key, and data for all charts and tables for the report type is grouped by this key. Keys can include multiple fields, and it is the combination of values in these fields that uniquely identifies a row.
Metrics
A metric is a numeric field in a chart or table. Charts and tables in the template, except those containing logs, include one or more numeric fields from the datastore table. Each numeric field is called a metric.
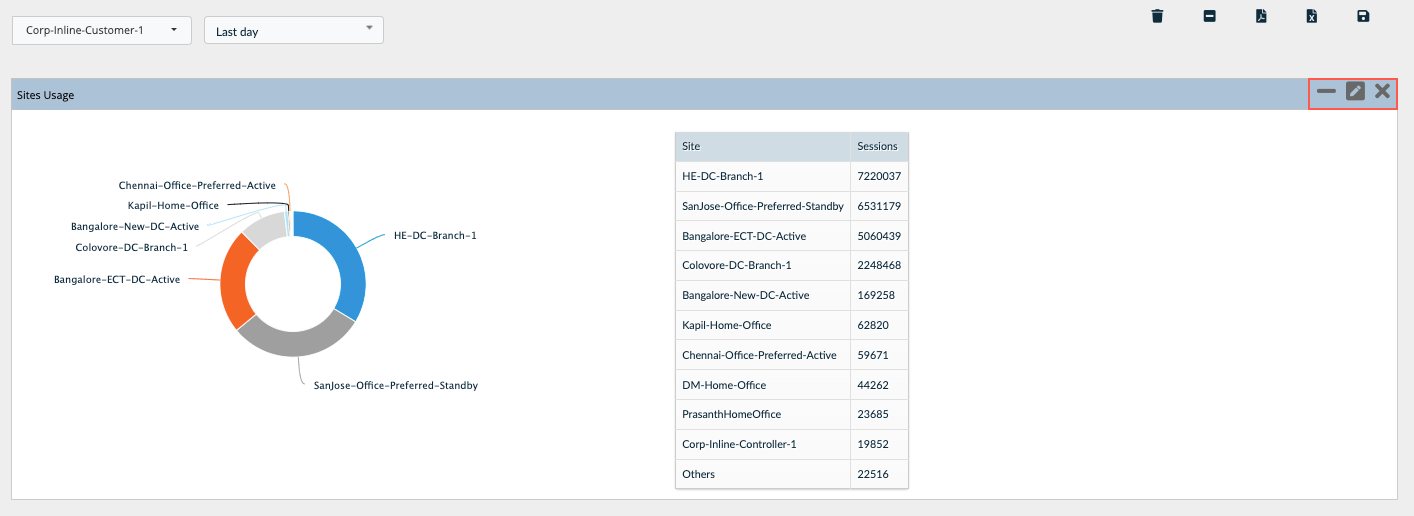
For each key value, a chart or table displays a calculation on its metrics for the time period of the template. For example, for report type VRF Usage Per Site, the key is the combination of fields Site and VRF Name. In the following figure, the user has selected report type VRF Usage Per Site, chart type Pie Chart, metric Sessions, and time period last day. The table on the right displays the number of sessions for the last day for each key value, and this information is represented in the pie chart on the left.

For each metric, charts and tables display the following computations for each key value:
- For pie, bar, and column charts—Values for the metrics are summed over the time period.
- For tables—Values for the metrics are summed over the time period except for statistics metrics (see Statistics Metrics, below).
- For area, line, and stacked-bar charts—Values for the metrics are summed over time intervals, called the resolution, within the time period.
Bar and column charts can display up to two metrics, and pie and status-over-time charts display exactly one metric.
The fields for report types in category Logs are all treated as string fields, and therefore these report types have no metrics and can be displayed only as tables.
Note: Reports with combined data from multiple clusters (aggregator nodes) are different from single-cluster reports in the following ways:
-
For log tables (grid data), PDF and CSV reports, including scheduled reports, are limited to a maximum of 500 rows. To generate a report with more than 500 entries in a log table, you must generate an exported report from the report preview area. This process generates multiple exported reports, one for each child cluster of the aggregator node. See Export Logs from the Preview Area, below.
-
For reports that include statistics metrics, data is summed after the aggregator node receives data from all the child clusters.
-
For summary (pie, column, and bar) charts, in the consolidation process for top-N values, the top M values (where M > N) are determined by the child clusters, and the data is then consolidated on the aggregator node.
-
For top-N time series charts, the top-N summary is computed across the clusters, and for the top-N values, N time series queries are triggered.
Statistics Metrics
Some report types include statistics metrics, which provide additional information for a metric for the time period. The following are the available statistics metrics:
- MIN—Minimum value
- MAX—Maximum value
- AVG—Average
- MED—Median
- P95—95th percentile
The example report below is for the SD-WAN service type, Access Circuit Usage for SD-WAN report type. The table shows the standard metric, Sessions, with statistics metrics MIN, displayed in column Min Sessions, and MAX, displayed in column Max Sessions.

Appliance
The appliance defines which VOS device or devices for which you want to include data in the report. You can select the following options for the Appliance:
- All—Add a single chart or table with data for all VOS devices contained in the datastore table for the report type.
- Single appliance—Add a single chart or table for the selected VOS device.
- Multiple appliances—Add a separate chart or table for each VOS device that you select. The template builder adds multiple charts or tables to the template. You can alternately add a combined chart for the following types of charts: area charts, line charts, and stacked bar charts.
Note that Analytics reports sometimes refer to VOS devices (appliances) as sites.
Chart Type
The chart type defines the graphical format in which to display data in the report. You can choose from seven chart styles and one table style. Not all styles are available for all report types.
The template builder and report template wizard offer the following styles:
- Summary charts—Provide global top N statistics for the total time period for a single metric. N can be changed using the field “Number of rows." The default is 10 rows. There are three types of summary charts:
- Pie chart
- Bar chart
- Column chart
- Time series charts—Provide a view of the data over the specified time period (for example, every hour or every day). There are four types of time series charts:
- Area chart
- Line chart
- Stacked bar chart
- Status-over-time chart—For more information, see the Status-Over-Time Chart.
- Table view—An aggregated view of the data for one or more metrics for the specified time period, with the ability to sort on most rows.
Status-Over-Time Chart
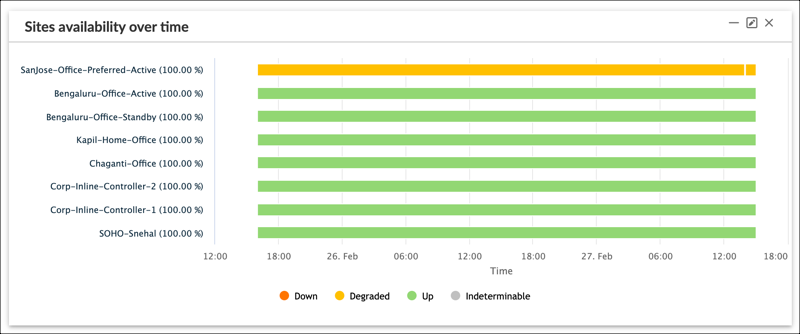
Status-over-time charts display a horizontal bar for each key value for the times listed along the x axis. The status is indicated by the color of the bar, as follows:
- Green—good or up
- Yellow—fair or degraded
- Red—poor or down
For report types that offer status-over-time charts, such as the report types Sites Availability over Time and Quality of Experience per Path, status-over-time is the only available chart type.
There is no icon representing status over time in the chart type section of the manual template builder screen or report template wizard.
The following example displays a status-over-time chart for service type SD-WAN, report type Sites Availability over Time, All appliances.
Filters
Filters define limits to the data in a chart or table, so that the data only includes records that match the search criteria defined in the filter.
Filters for Releases 23.1.1 and Later
To define a filter, you create match criteria for numeric fields (metrics) and site tags. The following are the criteria menu bars:

- Top menu bar—Matches site tags. Site tags define a group of VOS devices. When you add a site tag filter, the chart or table is limited to only devices included in the tag. For information about site tags, see Configure and Use Site Tags in Versa Analytics Dashboards and Log Screens. To use the menu bar, select Tag in the first drop-down list, and then select a site tag in the second drop-down list.
- Bottom menu bar—Matches numeric fields (metrics). To use the menu bar, select a metric, comparison operator, and value in the three drop-down lists, respectively.
Filters for Releases 22.1.4 and Earlier
To define a filter, you create match criteria for fields using the following criteria menu bars:
Numeric criteria menu bar—(For Releases 21.2.1 and later) Allows you to select records using a numerical comparison operator.

String criteria menu bars—Allows you to select records using a search pattern. There are two versions, as displayed below. The first version selects records that match a given pattern, and the second version selects records that either match or do not match a given pattern.


When you add multiple string criteria for the same field, the filter uses OR logic to match the string criteria on that field. When a filter contains multiple criteria, same-field string criteria are evaluated first, and then the filter uses AND logic to match records that meet all other string and numeric criteria.
Numeric Criteria
To match numeric fields, select the field from the numeric criteria menu bar. Select the greater than >, less than <, equals =, or not equals ≠ operator, and then enter a numeric value for comparison. The fields in the first drop-down list are metrics for the current report type, and the numerical comparison is applied to the sum of the metric over the time period.
When entering numeric values, you can use K (kilobytes), M (megabytes), and G (gigabytes). For example, you can enter 2K instead of 2000, or 3M instead of 3000000.
For example, for service type SD-WAN and report type Site to Site Path SLA, to include only site-to-site entries with a delay value of greater than 40.0 ms, choose Delay, the great than > operator, and enter value 40.0.
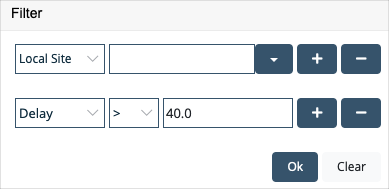
Example filter output:

String Criteria
To match string fields, use one of the following two string criteria menu bars:
The following rules apply for creating string criteria:
- Select a field from the drop-down list, and then enter a pattern that matches the entire field. If using the second version of the string criteria menu bar, also select the Is Equal To option. Patterns are case sensitive.
For example, for service type SD-WAN and report type Sites Availability, to display entries with site names matching SDWAN-Branch4, select the Site field and use pattern SDWAN-Branch4.

Example output:

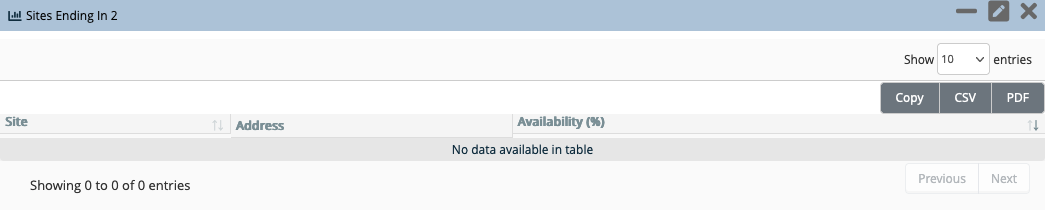
- Do not enter a partial pattern.
For example, to display entries with site names containing the character 2, you cannot enter the pattern 2.
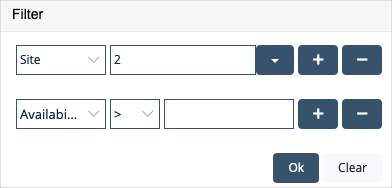
Example filter output:
-
To match any number of characters in a pattern, use the asterisk (*) as a wildcard character.
For example, for service type SD-WAN and report type Sites Availability, to define a table with site names containing the string Controller, select the field Site and enter the search pattern *Controller*.

Example filter output:

-
If the string criteria menu bar offers the Does Not Equal option, you can search for records that do not match the pattern by selecting this option.
Number of Rows
The Number of Rows component has a different effect based on the type of chart you select:
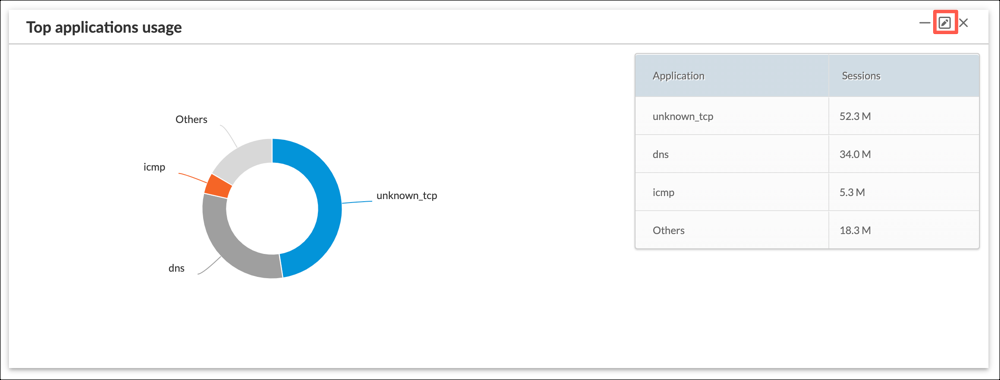
- Pie, bar, and column charts—Enter the number of top (largest) values to display in the chart. All other entries are grouped into an Others category.
- Line, area, and stacked-bar charts—Enter the number of top values to display. Other entries are not included in the chart.
- Status-over-time charts—Enter the number of key values to display. Other entries are not included in the chart. For information about key values, see Report Type and Metrics, above.
- Tables—Enter the number of rows to include in the table. This field only affects the CSV and PDF reports you generate from the template; the table in the preview area still includes all rows. It is not recommended that you use this option to export large log tables, those containing more than 100,000 rows, to a report. To export large log tables, create an exported report. For more information, see Export Logs from the Preview Area.
- For exported log tables—Number of logs to export when you click the Export icon for a table in the preview area. For more information, see Export Logs from the Preview Area.
For example, in the chart below, the number of rows equals 5. In the pie chart, the top 5 sites are represented individually and all other sites are grouped together into the Others category.

Use the Versa Report Template Wizard
For Releases 23.1.1. and later.
You can use the Versa report template wizard to generate a custom report template. You can perform the following tasks in the wizard:
- Define charts and tables to include in the template.
- Save the template.
- Generate a one-time report from the template, in PDF or CSV format.
- Schedule the automatic generation of reports based on the template.
Enable the Wizard
To enable the report template wizard:
- Select Analytics > Administration > Configurations > Settings.
- In the main pane, select the Reporting tab.
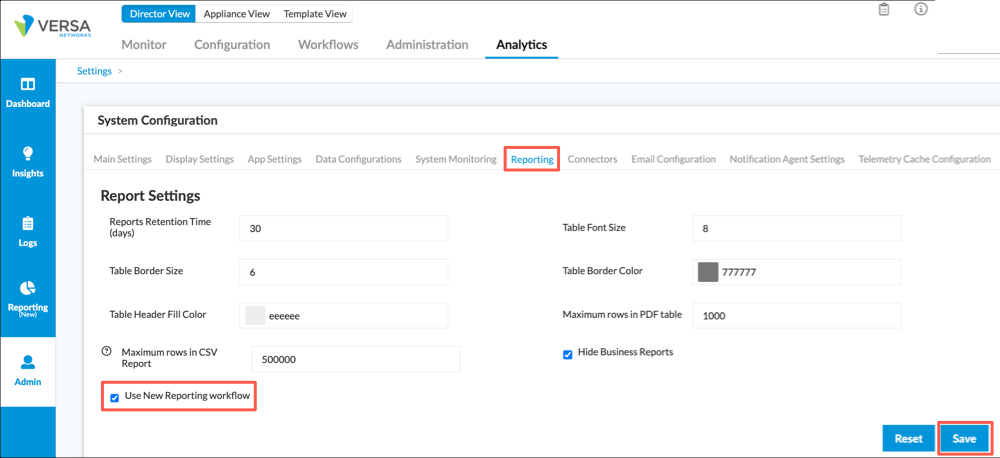
- Click the checkbox for Use New Reporting Workflow.
- Click Save.
Add a Custom Template from the Wizard
To generate a custom template using the report template wizard:
- In Director view, select the Analytics tab.
- Hover over the Analytics tab and select a node from the Analytics cluster containing the data for the report. To generate a template for reports that combine data from multiple Analytics clusters, select an Analytics aggregator node that combines data for the clusters.
- Select Reporting > Build in the left menu bar.
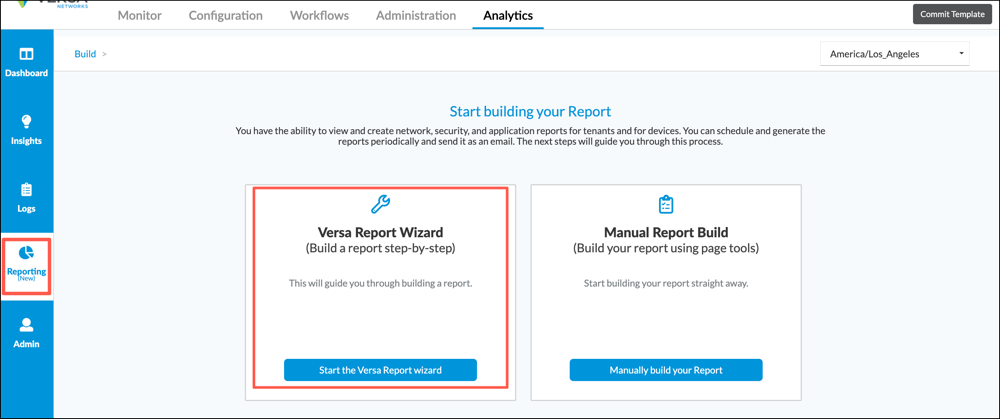
- Click Start the Versa Report Wizard. The following workflow displays.
Each pass through the workflow creates a chart or table definition for the current report template.
- Define a chart or table:
Note that any charts and tables you define using the workflow are stored temporarily until you save the template. If you navigate away from the wizard before saving the template, the chart and table definitions are lost.
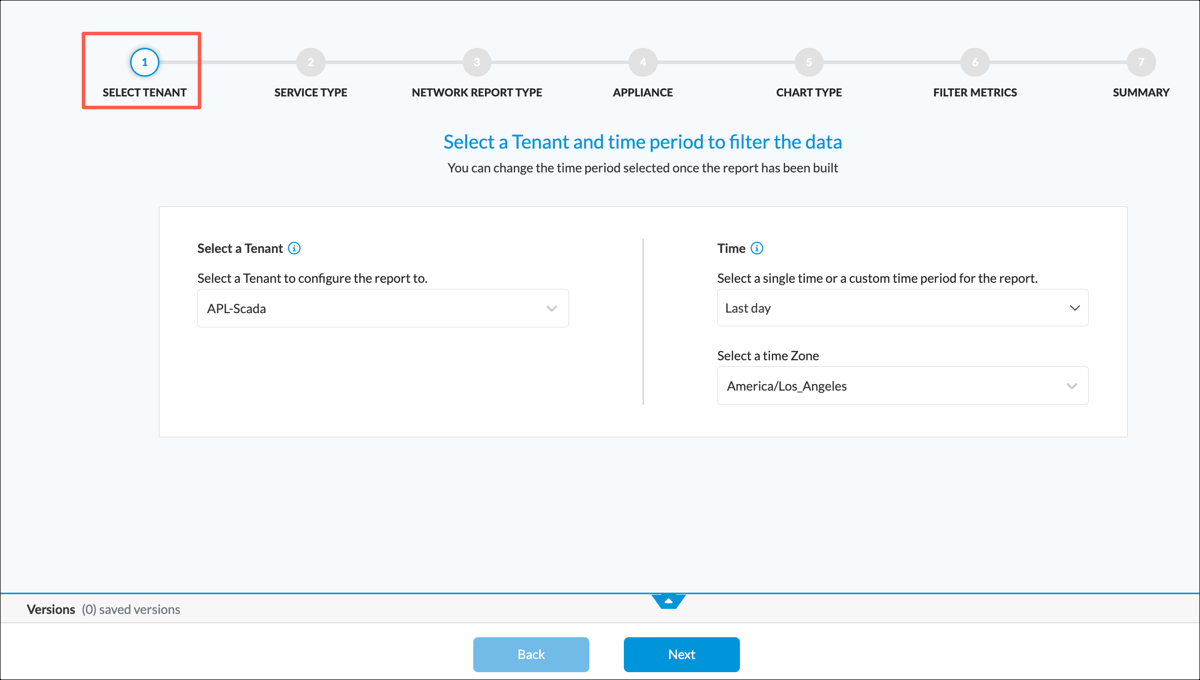
- Select workflow step 1, Select Tenant. Enter information for the following fields.
Field Description Select a Tenant Select an organization from the drop-down list. If the organization has sub-organizations (subtenants), charts and tables can include information from the sub-organizations. Time Select a time period for the chart or table. Time periods are relative to the time a report is generated from the template. Select a Time Zone Select the time zone. - Click Next or select workflow step 2, Service Type.
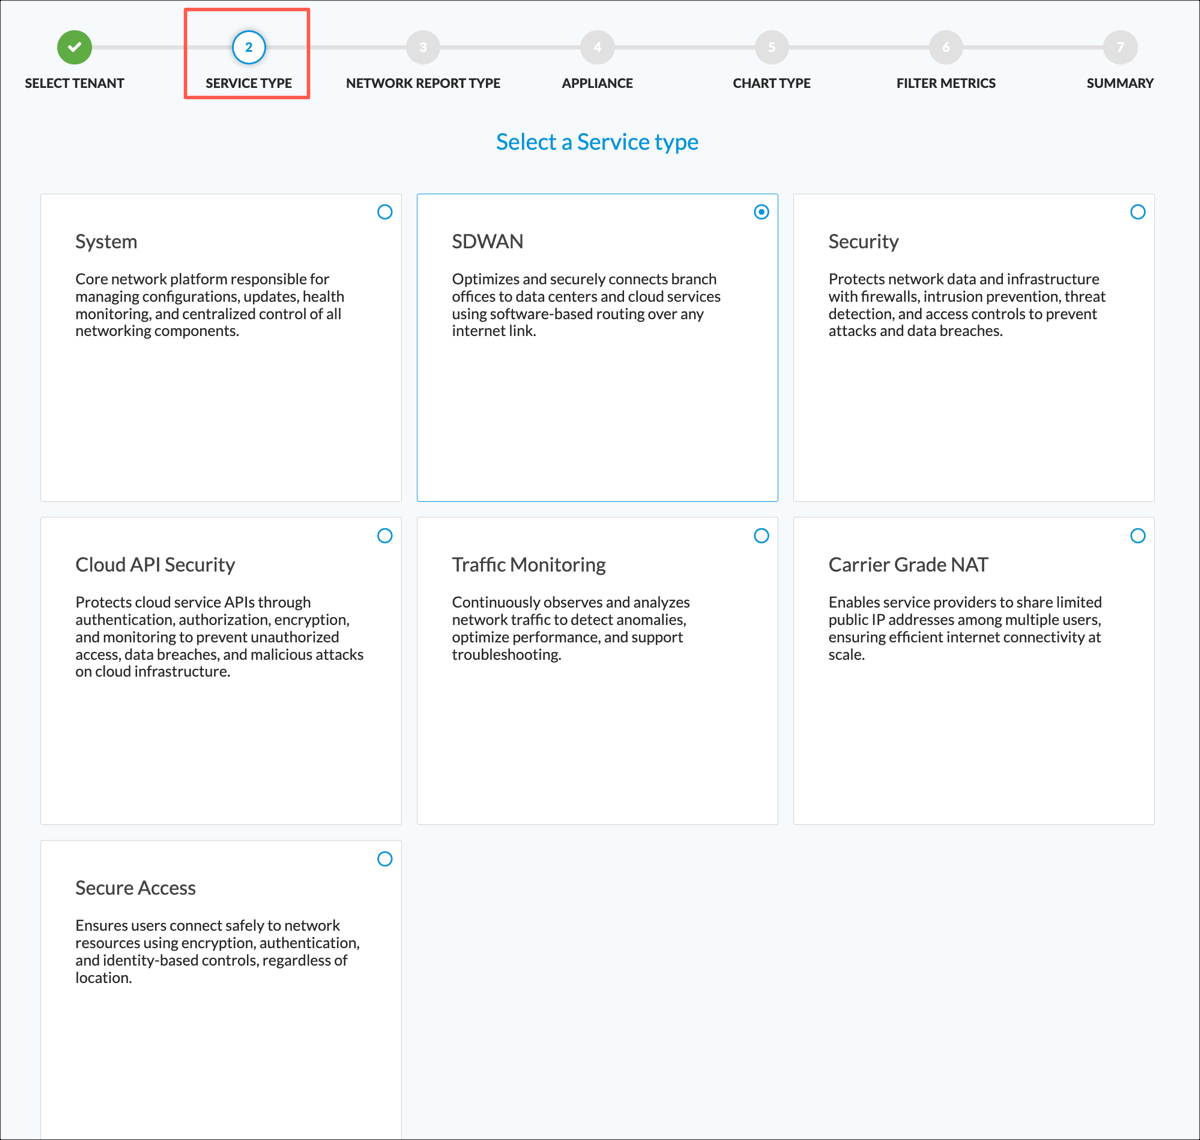
- Select a service type. This is the category of data used in the chart or table.
- Click Next or select workflow step 3, Network Report Type. The screen displays the available report types for the service type you selected in the previous workflow step.
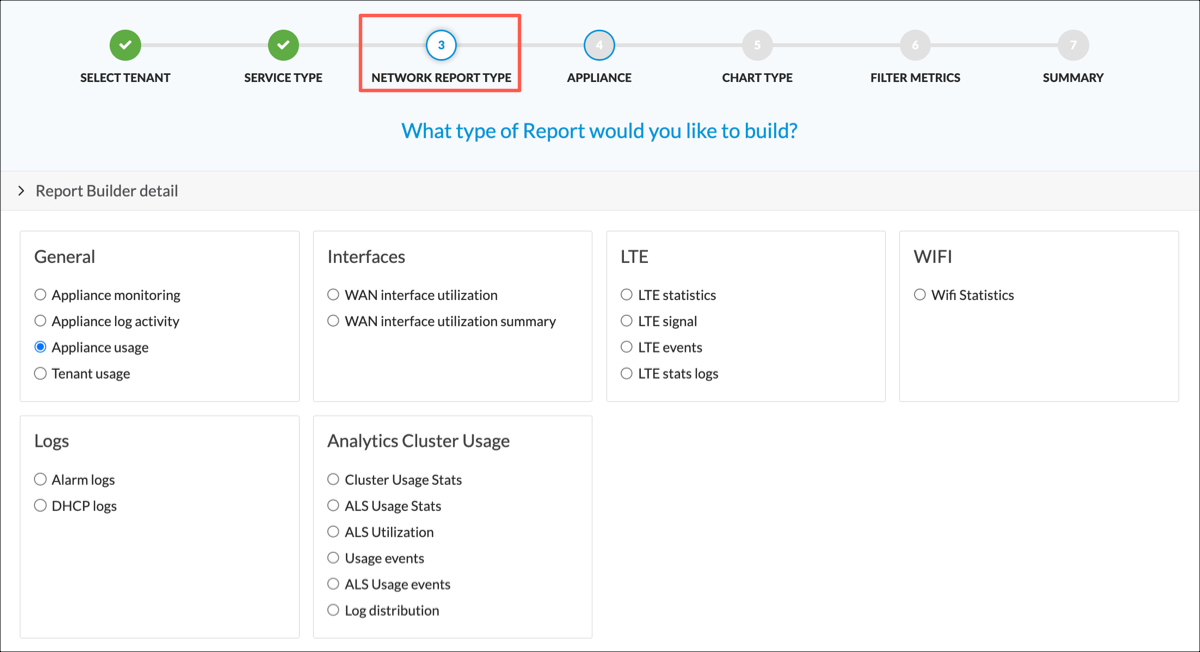
- Select a network report type.
- Click Next or select workflow step 4, Appliance.

- Select one or more appliances to include in the chart or table definition, or select All to include all appliances. If you select All, then the template generates a chart or table with combined information from all appliances. If you select multiple individual appliances, then by default the template generates a separate chart or table for each appliance.
- Select workflow step 5, Chart Type.

- Select a type for the chart. For a description of the chart types, see Chart Type, above.
- Optionally, select one of the options described in the following table:
Option Description Include Subtenants Charts (For charts based on report types Appliance Usage and Tenant Usage only.) If you selected an organization with subtenants in workflow step 1, Select Tenant, then by default charts include only data for the selected organization. Select this option to also include subtenant data.
Combine Charts (For area charts, line charts, and stacked bar charts only.) If you selected multiple individual appliances in workflow step 4, Appliance, then by default separate charts are generated for each appliance. Select this option to generate a combined chart instead of individual charts.
Resolution (For area charts, line charts, and stacked bar charts only.) This setting indicates the interval within the selected time period that the Analytics application uses to either sum or average the data for the chart metric. Metrics sessions, volume TX, and volume RX are summed and other metrics are averaged over the interval. The interval choices are:
- Minute—The data is summed or averaged in resolutions of either 5 or 15 minutes, depending on the configuration.
- Hourly—The data is summed or averaged per hour.
- Daily—The data is summed or averaged per day. Not that the day change is calculated based on UTC time, which might not match your local time zone.
- Auto—Resolution is set to Minute when the time period is less than 24 hours, Hourly when the time period is between 24 hours and 7 days, and Daily when the time period is greater than 7 days.
Note: Selecting resolution minute or hour for a large time period, such as 7 days or more, is very CPU and memory intensive and reports take longer to generate.
Default: Auto
- Click Next or select workflow step 6, Filter Metrics.
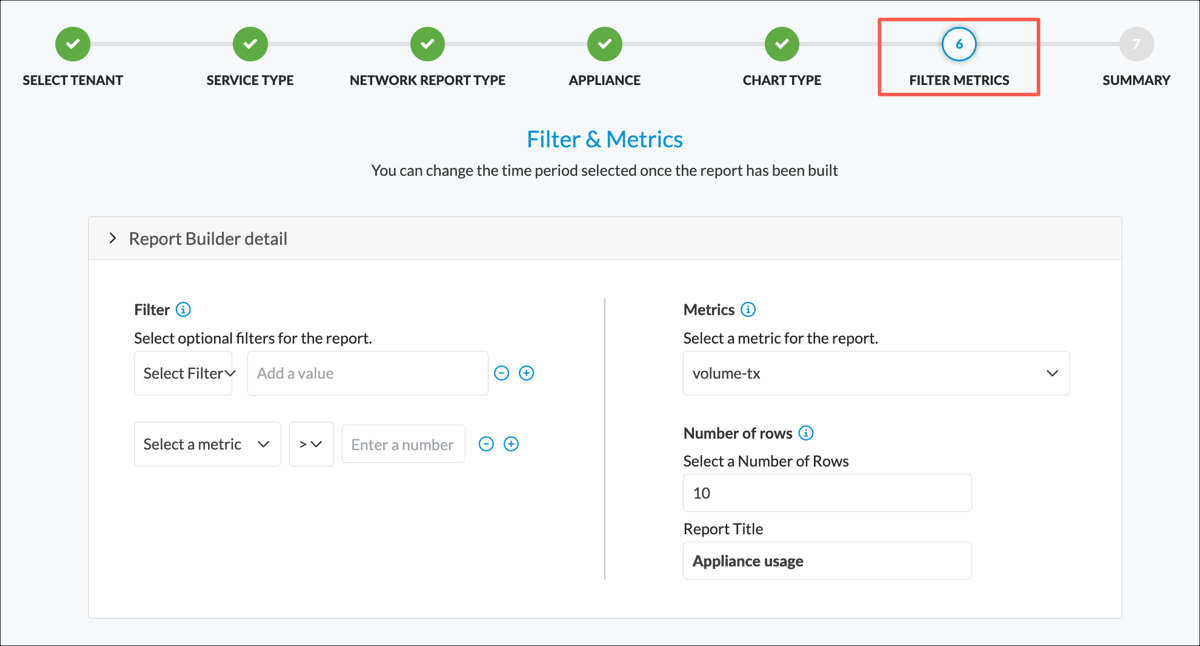
- Enter information for the following fields.
Field Description Filter (Group of Fields) - Select Filter
Select Tags to use a site tag to identify a group of appliances to include in the chart or table. For more information, see Configure and Use Site Tags in View Analytics Dashboards and Log Screens. - Select Value
Select a site tag. - Select a Metric
Select a metric (numeric) field to use for filtering the table. The combination of this field, the comparison operator, and the number define a match criterion. - Comparison Operator
Select a comparison operator for the match criterion. - Number
Enter a numeric value for the match criterion. You can use K (kilobytes), M (megabytes), and G (gigabytes). For example, you can enter 2K instead of 2000 or 3M instead of 3000000. - + Add
After selecting a metric and comparison operator, and entering a number, click + Add to add the match criterion.

Click + Add again to display an empty entry, allowing you to add another match criterion.
Metrics Select the metric or metrics to display in the chart or table. Bar and column charts can display up to two metrics and pie and status-over-time charts display exactly one metric. Tables can display all metrics and also statistics metrics. For information about metrics, see Report Type and Metrics, above.
Number of Rows Enter the number of rows. See Number of Rows, above, for more information. Default: 10
Maximum for Analytics aggregator nodes: 500
Report Title Enter a name for the chart or table. This is the title presented above the chart or table when you generate a report from the template. - Click Next or select workflow step 7, Summary.

- Check the values you entered in workflow steps 1 through 6. To edit any of the information, click the Edit icon, make your changes, and then click workflow step 7 to return to the Summary screen.
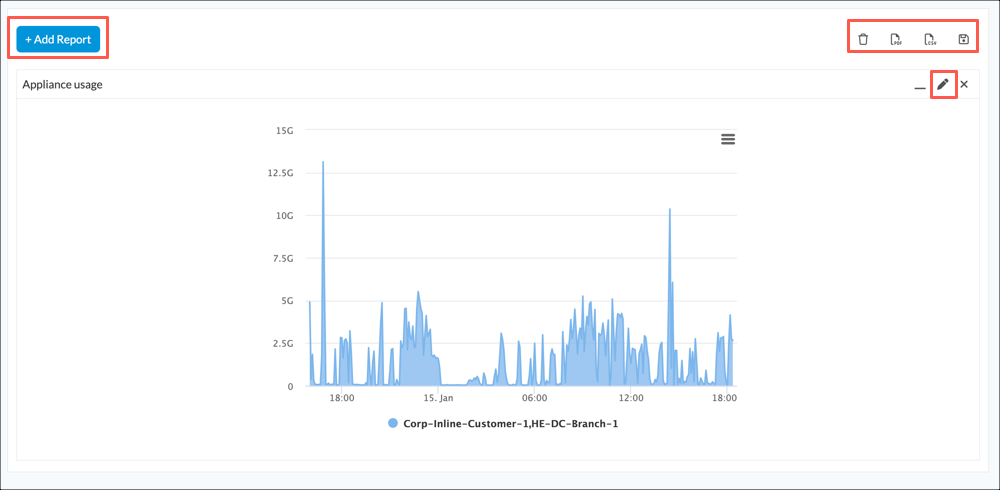
- Click Build Report to add the chart or table to the current template. A preview of the current template displays, including all the charts and tables you have defined.
- Select workflow step 1, Select Tenant. Enter information for the following fields.
- To add an additional chart or table, click + Add Report, and then repeat Step 5.
- To edit the definition for any chart or table, click the
 Edit icon in the upper-right corner of the chart or table.
 - To generate a sample report, click PDF or CSV to generate the report in PDF or CSV format, respectively. Note that generating a sample report does not automatically save the template. If you navigate away from the wizard before saving the template, the template is lost.

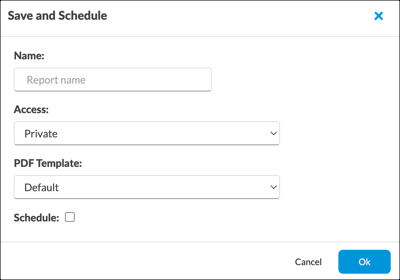
- To save your template, click the Save and Schedule icon in the horizontal menu bar.

The Save and Schedule popup window displays.
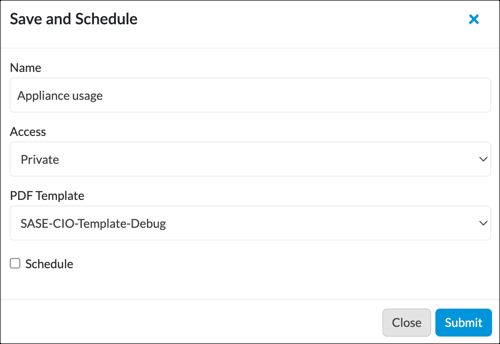
- Enter information for the following fields.
Field Description Name Enter a name for the custom report template. Access Select the access permission for reports generated from the template:
- Private—Tenant user who created the report and provider users with tenant access can view, edit, and delete the report.
-
Shared—Any tenant user and provider users with tenant access can view, edit, and delete the report.
-
Shared Read Only—Any tenant user and provider users with tenant access can view the report. Only the tenant user who created the report and provider users with tenant access can edit and delete the report.
PDF Template Select a PDF template. For information about PDF templates, see Manage Document Design for Custom Reports, below. Schedule Click to schedule automatic report generation, then follow Steps 5 through 8 in Schedule Custom Report Generation. - Click Submit. Note that after you save the template, you must use the manual template builder to edit and manage the template.
Modify a Custom Template from the Wizard
You can modify the currently loaded custom template from the report template wizard. See procedure Step 7 in Build a Custom Template from the Wizard, above.
To modify a template that is not currently loaded into the wizard, you must use the manual template builder. See Modify a Custom Template Using the Builder, below.
Use the Manual Template Builder
You can build a custom template from the manual template builder screen.
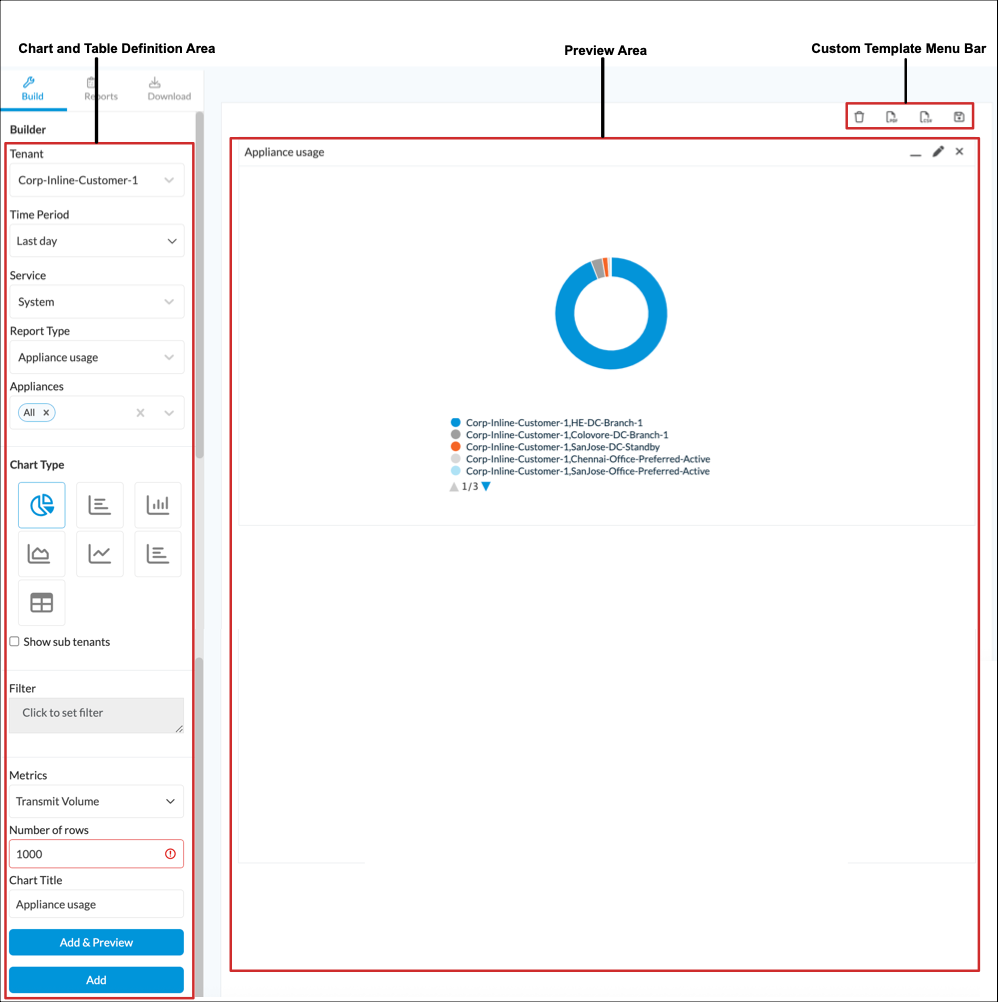
The manual template builder includes the following components:
- Chart and table definition area—Define the charts and tables to include in the template. Click Add or Update to display a preview of the chart or table in the preview area. Each of the fields in the chart and table definition area is discussed in more detail in Report Components, above.
- Tenant menu—(For Releases 22.1.4 and earlier.) Select the tenant for which to generate a report. Each custom template is for a single tenant. The drop-down list shows all the tenants included in datastores in the Analytics cluster.
- Time period menu—(For Releases 22.1.4 and earlier.) Select the time period of the data to include in the report. You can choose a preselected or a custom time period.
- The preselected time periods are the last 5, 15, or 30 minutes, the last 1 hour or 12 hours, the last 7 or 30 days, and the last month. These time periods are relative to the time when the report is generated from the template.
- For a custom time range, you can define a custom range of minutes, hours, days, weeks, or months, and you can define a date and time range. All nodes in the Analytics cluster must use NTP to synchronize their times to ensure accuracy for the selected time period.
- Preview area—Displays a preview of all charts and tables that are included in the custom template.
- Custom template name—Displays the name of the saved custom template. If you have not saved a custom template, no name displays in this area.
- Custom template menu bar—Contains menu items for saving and deleting custom templates, and for generating sample CSV and PDF reports from the current template.
The manual template builder screen displays the current custom template. From this screen, you can build a new template, or load and edit an existing template.
The following screenshots show the components of the manual template builder screen:
- For Releases 23.1.1 and later:
- For Releases 22.1.4 and earlier:

You must save the custom template before you can manage it using the Analytics > Reporting > Manage tab. You assign a name when saving the custom template, and all items associated with the custom template are identified by this name, including:
- Saved reports—The saved custom template.
- Completed reports—The reports generated from this custom template. Since all completed reports generated from a saved template have the same name, the Analytics application assigns a unique ID number to distinguish between the reports.
- Scheduled reports—A set of time parameters for automatic report generation using the saved custom template. The Analytics application generates completed reports automatically based on these parameters.
When you first create a custom template manually, you can generate a sample report, but the template exists only in memory and is lost if you refresh your browser window or select a different custom template. To retain the custom template, you must save it. It is then stored in the Analytics database. For a custom template that has been saved, you can configure the Analytics cluster to periodically generate a completed report from the template. You can also generate a report from a stored template manually at any time.
Add a Custom Template from the Manual Template Builder
- In Director view, select the Analytics tab.
- Hover over the Analytics tab and select an Analytics node.
- For Releases 23.1.1 and later:
- When the report template builder is not enabled, select Reporting > Build in the left menu bar. The manual template builder displays.
- When the report template wizard is enabled:
- Select Reporting > Build in the left menu bar. The Start Building your Report screen displays.

- Click Manually Build Your Report in the main pane. The manual template builder displays.
- Select Reporting > Build in the left menu bar. The Start Building your Report screen displays.
- For Releases 22.1.4 and earlier, select Reporting > Build in the left menu bar. The manual template builder displays.
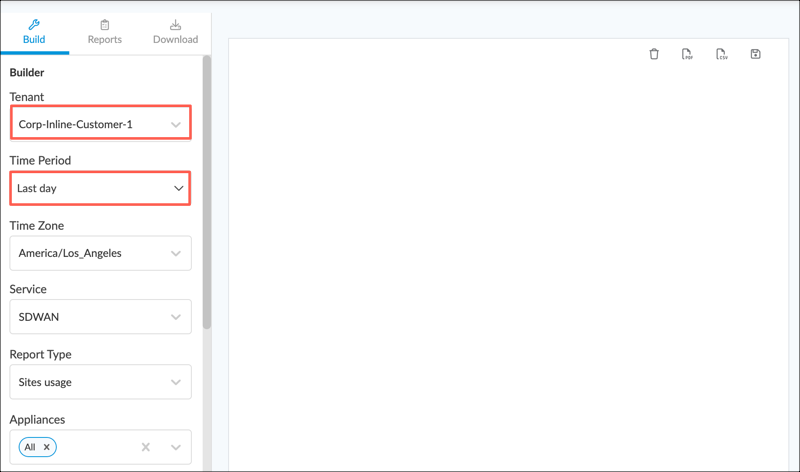
- For Releases 23.1.1 and later:
- Select a tenant in the Tenant field.
- Select a time period in the Time period field.
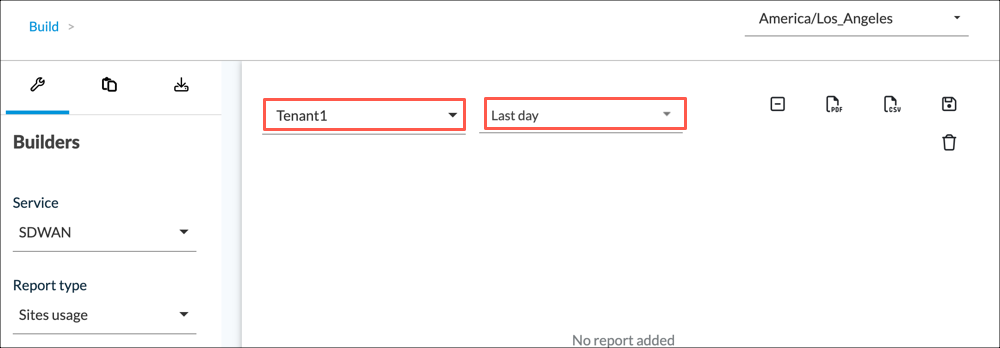
- For Releases 22.1.4 and earlier, select a tenant from the first drop-down list and a time period from the second drop-down list in the main pane.
- Add one or more chart or table definitions, as described in Modify a Chart or Table, below. Adding the first chart or table definition activates the custom template menu bar.
- For Releases 23.1.1 and later, the custom template menu bar displays as follows:

- For Releases 22.1.4 and earlier, the custom template menu bar displays as follows:
- For Releases 23.1.1 and later, the custom template menu bar displays as follows:
- In the custom template menu bar, click the
 Save icon to display the Save and Schedule popup window. Enter information for the following fields.
Field Description Name Enter a custom template name. Access (For Releases 22.1.1 and later.) Select the access permission for reports generated from the template:
- Private—Tenant user who created the report and provider users with tenant access can view, edit, and delete the report.
-
Shared—Any tenant user and provider users with tenant access can view, edit, and delete the report.
-
Shared Read Only—Any tenant user and provider users with tenant access can view the report. Only the tenant user who created the report and provider users with tenant access can edit and delete the report.
PDF Template Select a PDF template. For information about PDF templates, see Manage Document Design for Custom Reports, below. Schedule Click to schedule automatic report generation, then follow Steps 5 through 8 in Schedule Custom Report Generation. - Click OK.
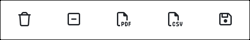
- To perform other operations on the custom template, select an icon from the custom template menu bar.
Icon Action  Trash icon
Delete the current custom template. This clears the preview area.  Collapse icon
(Releases 22.1.4 and earlier.) Collapse all chart and table previews.  PDF icon
Generate a sample report from the current custom template, in PDF format. A browser-specific window displays allowing you to save the information in a local file. Sample reports are not stored in the Analytics database.  CSV icon
Generate a sample report from the current custom template, in CSV format. A browser-specific window displays allowing you to save the information in a local file. Sample reports are not stored in the Analytics database. Save iconSave the current custom template.
Add a Chart or Table from the Manual Template Builder
To add a chart or table definition to the current custom template:
- In the chart and table definition area, enter information for the following fields.

Field Description Service Select a service:
- SD-WAN—SD-WAN information such as site usage, SLA, and QoE.
- Secure Access—Secure access information such as user statistics and failed and successful access attempts.
- Security—Security information such as top applications, top threats, and top URLs.
- Carrier Grade NAT—NAT information such as top post NAT source, top destination and sources addresses, and CGNAT logs.
- Traffic Monitoring—Traffic monitoring information such as top applications, top HTTP hosts, and traffic monitoring logs.
- System—VOS device information such as device alarms logs, appliance monitoring, and WAN interface utilization.
- Cloud API Security—(For Releases 23.1.1 and later.) API security information for infrastructure as a service (IaaS) and software as a service (SaaS) applications.
Default: SD-WAN
Report Type Select a report type. The report types are specific to the service that you select.
Appliance Select one or more VOS devices, or select All to include all VOS devices. Default: All
Chart Type (optional) Select a chart type, or select table. Only charts available for the selected report type display. For report types that support only tables or status-over-time charts, this field does not display. For a description of the chart types, see Chart Type, above.
Include Subtenants (optional) (For Releases 22.1.4 and later. For report types Appliance Usage and Tenant Usage, which are listed under service type System, only.)
Select to include subtenant data in the chart.
Combine Charts (optional) (For area charts, line charts, and stacked bar charts only.)
Select to define a combined chart instead of individual charts when you select multiple individual VOS devices in the Appliance field, above.
Resolution (optional) (For area charts, line charts, and stacked bar charts only.)
This setting indicates the interval within the selected time period that the Analytics application uses to either sum or average the data for the chart metric. Metrics sessions, volume TX, and volume RX are summed and other metrics are averaged over the interval. The interval choices are:
- Minute—The data is summed or averaged in resolutions of either 5 or 15 minutes, depending on the configuration.
- Hourly—The data is summed or averaged per hour.
- Daily—The data is summed or averaged per day.
Note: The day change is calculated based on UTC time, which might not match your local time zone. - Auto—Resolution is set to Minute when the time period is less than 24 hours, Hourly when the time period is between 24 hours and 7 days, and Daily when the time period is greater than 7 days.
Note: Selecting resolution Minute or Hourly for a large time period, such as 7 days or more, is very CPU and memory intensive and reports take longer to generate.
Default: Auto
Filter Select the Click to Set Filter box, and then:
- Enter a search criterion. For more information, see Filters.
- To add additional search criteria, click the
 Add icon for an existing criterion of the same type, numeric or string.
 - To remove search criteria, click the Minus icon, or click Clear to clear all search criteria.
- Click OK to add the filter.
Metrics Select one or more metrics to include in the table or chart.
Number of Rows Number of Rows. For more information see Number of Rows, above.
Default: 10
Maximum for Analytics aggregator nodes: 500
Note: It is not recommended that you use this option to export large log tables, those containing more than 100,000 rows, to a report. To export large log tables, use the Export icon in the preview area to create an exported report. For more information, see Export Logs from the Preview Area.Sort By (Releases 22.1.3 and later.) For report types that use status-over-time charts, select Ascending or Descending to sort the chart into ascending or descending order. Report Name Enter a name for the chart or table. This name is used to label the chart or table, both in the preview area and when generating a report from the custom template. - Click the Add & Preview icon. The chart or table definition is added to the custom template and a preview of the chart or table displays in the preview area.
- To collapse the preview of a chart or table, select the collapse icon.
- To delete a chart or table from the custom template, select the
 delete icon.
Modify a Custom Template from the Manual Template Builder
To modify a saved template, you upload it from the Load a Report screen, and then edit it from the Build screen.
To modify a custom template:
- For Releases 23.1.1 and later.
- When the report template wizard is not enabled:
- In Director view, select Analytics > Reporting > Build.
- Select the Reports tab. The Load a Report screen displays.
- When the report template wizard is enabled:
- In Director view, select Analytics > Reporting > Build.
- In the main pane, select Manually Build Your Report. The template builder screen displays.

- Select the Reports tab. The Load a Report screen displays.
- In Director view, select Analytics > Reporting > Build.
- When the report template wizard is not enabled:
- For Releases 22.1.4 and earlier:
- In Director view, select Analytics > Reporting > Build.
- Select the Load tab. The Load a Report screen displays.
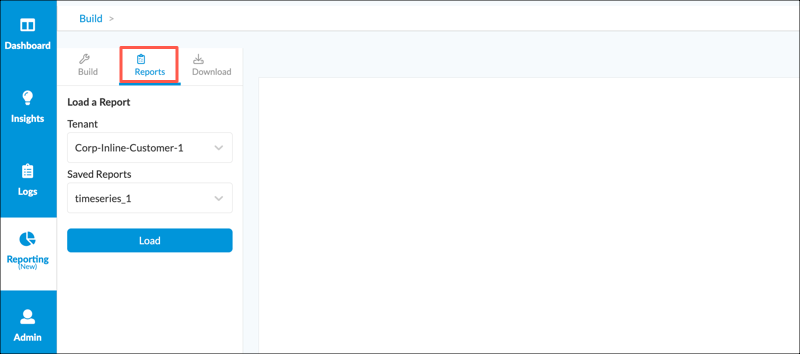
- From the Load a Report screen:
- Select a tenant from the Tenant drop-down list.
- Select a custom template from the Saved Reports drop-down list. If the Saved Reports list is empty, then no saved custom templates exist for the selected tenant.

- Click Load. The custom template displays in the preview area.
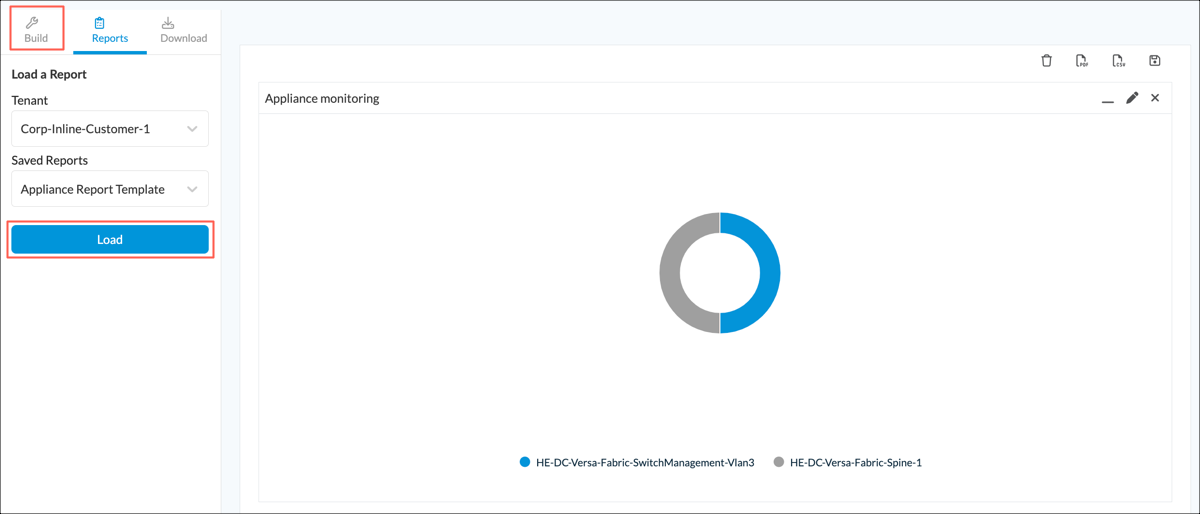
- Click the Build tab. The view changes to the manual template builder screen with the loaded template displayed in the preview area.
- Add or modify chart or table definitions, as described in Modify a Chart or Table from the Manual Template Builder, below.
- Select the Save icon from the custom template menu bar, then click OK.
Modify a Chart or Table from the Manual Template Builder
You can modify some parameters for a chart or table after you have added it to a custom template. The parameters you cannot modify are the service type, report type, and appliance. To change these parameters, you must delete the existing chart or table and add a new one.
You can select a different time period for a custom template after charts and tables have been defined. All existing charts and tables are updated to the new time period and their previews automatically refresh.
To modify a chart or table definition:
- In the preview for the chart or table, click the pencil icon.
Update and Cancel icons display in the chart and table definition area, and the parameters for chart or table are preselected in the drop-down list.

- Modify the items in the chart and table definition area as described in Step 2 of Add a Chart or Table from the Manual Template Builder, above.
- Click Update to save the changes, or click Cancel.
Export Logs from the Preview Area
For Releases 21.2.1 and later.
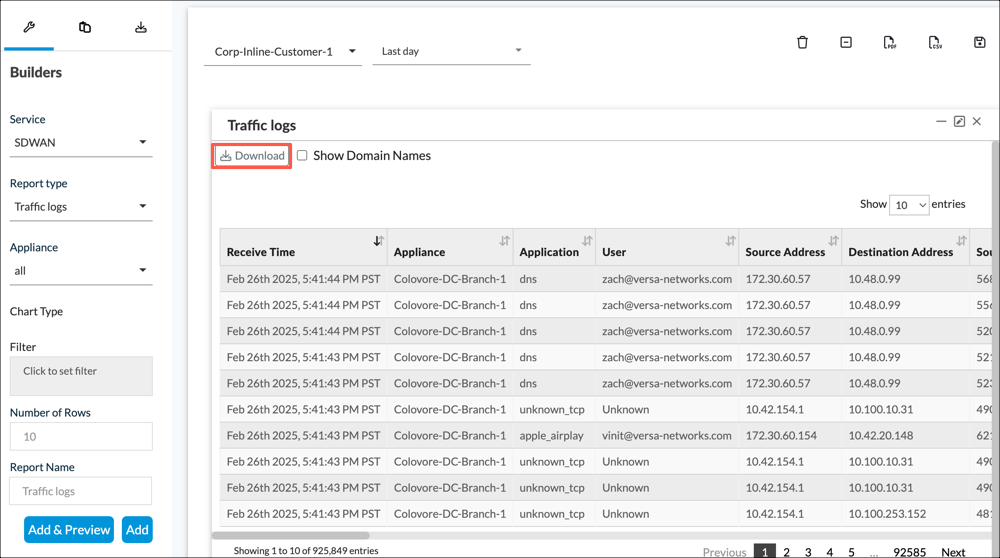
Some types of reports include logs. These report types are only available as tables. The table preview displays an Export button which you can select to store a copy of the logs contained in the table. This copy, called an exported report, is stored in the Analytics database using the table preview name.
To view exported reports, go to Analytics > Reporting > Manage > Exported Reports. From this screen, you can download the reports for the next seven days. After seven days, the exported reports are automatically deleted from the database.
Note that for Analytics aggregator nodes, exporting logs from the preview area generates multiple exported reports, one for each child cluster.
To export logs and view exported reports:
- For Releases 23.1.1 and later:
- When the report template wizard is not enabled, in Director view, select Analytics > Reporting > Build. The manual template builder displays.
- When the report template wizard enabled:
- Select Analytics > Reporting > Build.
- In the main pane, select Manually Build Your Report.
The manual template builder displays.
- For Releases 22.1.4 and earlier, select Analytics > Reporting > Build. The manual template builder displays.
- Select the Build tab in the main pane.

- In the Chart and Table Definition area:
- Select a report type containing logs. These report types are listed under category Logs in the Report Type drop-down list.
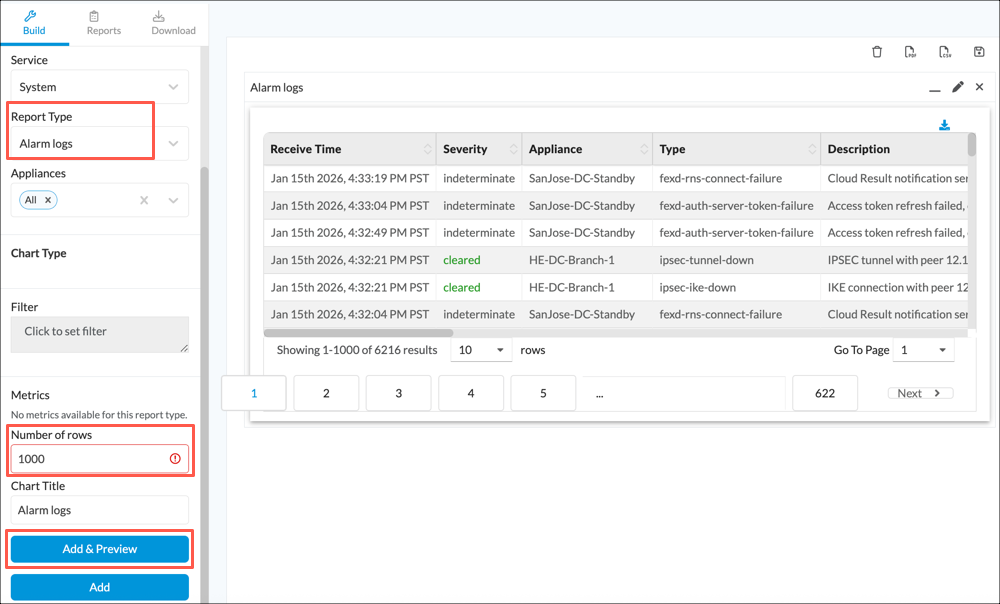
- In the Number of Rows field, enter the number of rows to export.
- Click Add & Preview. A table preview displays in the preview area.
- Select a report type containing logs. These report types are listed under category Logs in the Report Type drop-down list.
- For Releases 23.1.1 and later:
- In the table preview, click the
 Export and Download icon. Wait a moment while the logs are saved into an exported report in the database.

- A system-specific dialog displays for your local system. Follow the dialog to save the exported report to your local system.
- In the table preview, click the
- For Releases 22.1.4 and earlier:
- In the table preview, click the Export icon.

- Wait a moment while the logs are saved into an exported report in the database. In the table preview the Export icon is replaced with a Download icon.
- To download the exported report immediately to your local system, click the Download icon. A system-specific dialog displays allowing you to download the exported report.
- In the table preview, click the Export icon.
- To view a list of all exported reports, select Analytics > Reporting > Manage > Exported Reports.
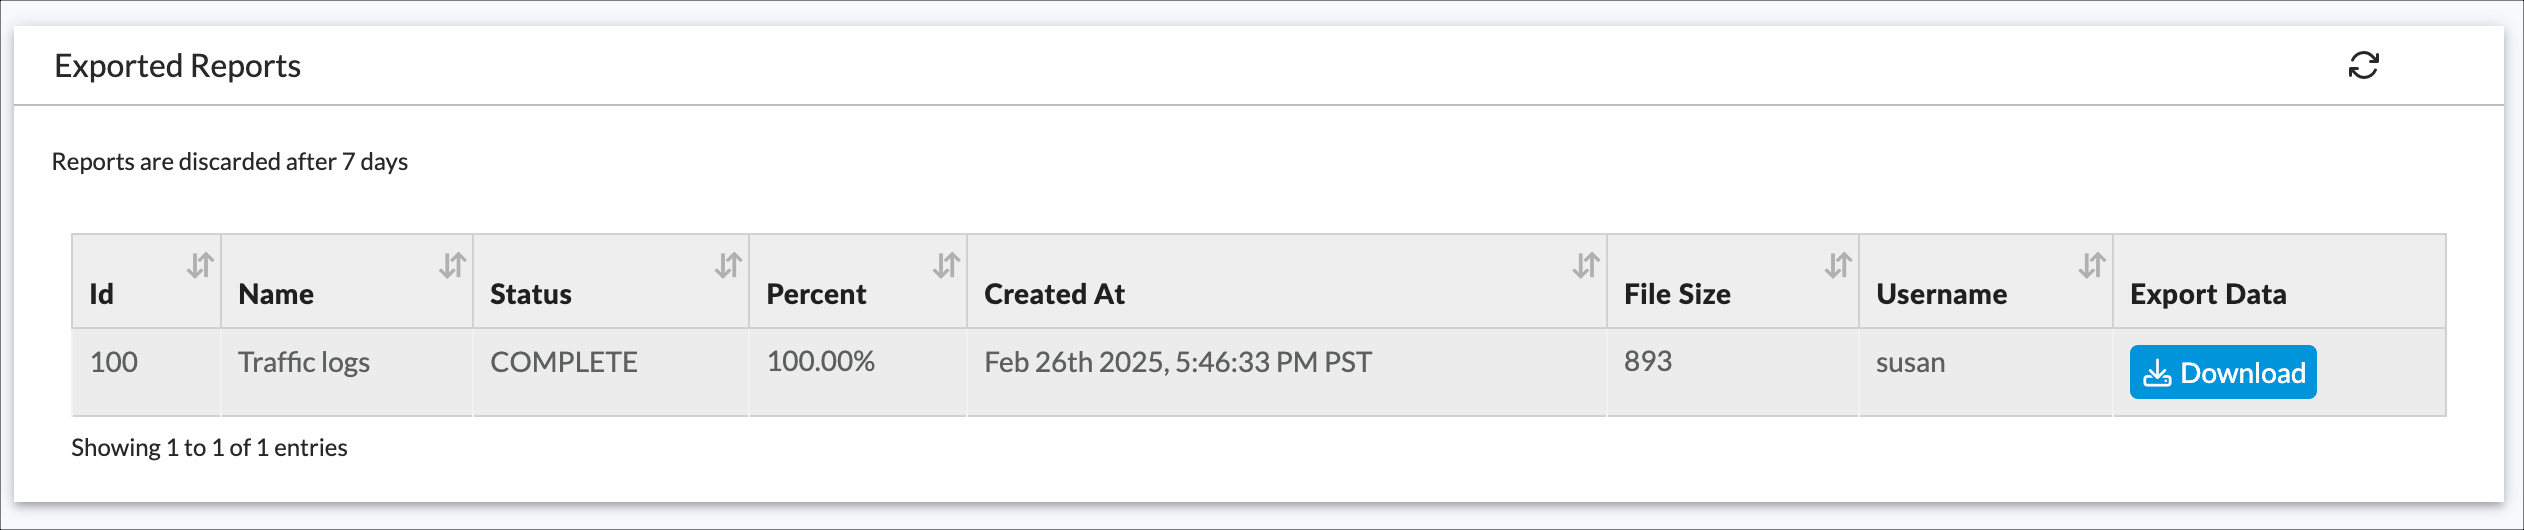
- To download an exported report, select the Download icon in the last column. A system-specific dialog displays enabling you to download the exported report to your local system.
Schedule Custom Report Generation
You can schedule a report to be generated, either immediately or at a preset time, when you save its custom template.
- To view generated reports, known as completed reports, go to Analytics > Reporting > Manage > Completed Reports.
- To view a list of all reports scheduled to be generated, see Manage the Report Generation Schedule, below.
Completed reports are stored in the Analytics database, and are retained in the database for a default period of 30 days.
- To modify the retention time, go to Analytics > Administration > Settings > Reporting and modify the value in the Reports Retention Time field.
With most templates, you enter the generation schedule on the Save and Schedule screen, and the Analytics cluster generates a single completed report from the template at the scheduled times. When all the charts and tables in a template are created for the same single VOS device (appliance), the Save and Schedule window includes an additional drop-down list, Execute Report For, which you can use to select additional VOS devices. In this case, the Analytics application generates multiple completed reports, one per VOS device, from the single template. The Analytics application substitutes each selected VOS device as the Appliance for each chart and table when generating the report and prepends the name of the VOS device to the template name when naming each completed report.
To schedule a report:
- You schedule a report from the Save & Schedule popup window. This window displays in the following cases:
- You are in the process of saving a template from the report template wizard. See Build a Custom Template Using the Wizard, above.
- You are in the process of saving a template from the manual template builder. See Build a Custom Template Manually, above.

In the Save & Schedule popup window, click the Schedule box to view the scheduling options.

- Click one of the following fields, and then enter information for the field.
Field Description Now Click to immediately generate a report from the template. Hourly Click to automatically generate a report from the template once per hour, then enter an interval in hours. Daily Click to automatically generate a report from the template once per day, then enter the daily time. Weekly Click to automatically generate a report from the template once per week, then enter the weekly day and time. Monthly Click to automatically generate a report from the template once per month, then enter the monthly day and time. -
To set an expiration time for reports generated hourly, daily, weekly, or monthly, click the Expiration box, and then select an expiration date.
-
To automatically send a copy of the report to a set of email addresses, enter a comma-separated list of email address In the Email Notification Recipients field. To attach the report in PDF or CSV format to the email, click the PDF or CSV box. Note that you must have configured SMTP for Analytics for this option to operate. For information about configuring SMTP for Analytics, see Configure SMTP in Perform Initial Software Configuration.
-
For templates that include the same single appliance for all charts and tables, you can optionally select additional appliances from the Execute Report For drop-down list. For more information about this feature, see Schedule Custom Report Generation, above.

-
Click OK.
Manage Report Generation
Generated reports are stored in the Analytics database, and you can export a CSV or PDF version of the report. This section describes how to manage completed reports, saved custom templates, and the report generation schedule.
You manage report generation from the Analytics > Reporting > Manage menu:

This menu includes the following terms:
- Completed reports—Reports generated from a template. Completed reports are identified by their template name and assigned a unique ID number.
- Scheduled reports—The report generation schedule, which consists of entries containing times to generate reports from templates.
- Saved reports—Custom templates saved from the template builder screen or from the report template wizard.
- Exported reports—A list of log sets exported from the preview area on the template builder screen. See Export Logs from the Preview Area.
Manage Saved Custom Templates
You manage custom templates for an organization from the Saved Reports screen.
To manage saved custom templates:
- In Director view, select Analytics > Reporting > Manage > Saved Report.
- Select an organization from the drop-down list in the main pane. The Saved Reports screen for the selected organization displays with the following fields.

Field Description ID Unique ID number assigned to the custom template. Name Custom template name. Date Timestamp when the custom template was last saved. Owner Name of the user who saved the custom template. - To delete one or more custom templates:
- Click the box or boxes in the column in front of the template ID number.
- Click the
Three-dot icon in the upper-right portion of the table.
- Select Delete.
- To schedule the Analytics application to generate a report for one or more templates, click the box or boxes in the column in front of the template ID number and then click Schedule; then, follow Steps 5 through 8 in Schedule Custom Report Generation.
Manage the Report Generation Schedule
You can view a list of times that reports are scheduled to be generated and edit the generation schedule from the Scheduled Reports screen. Each organization has a separate report generation schedule.
To view and edit the report generation schedule:
- In Director view, select Analytics > Reporting > Manage > Scheduled Reports.
- Select an organization from the drop-down list. The Scheduled Reports screen for the selected organization displays with the following fields.
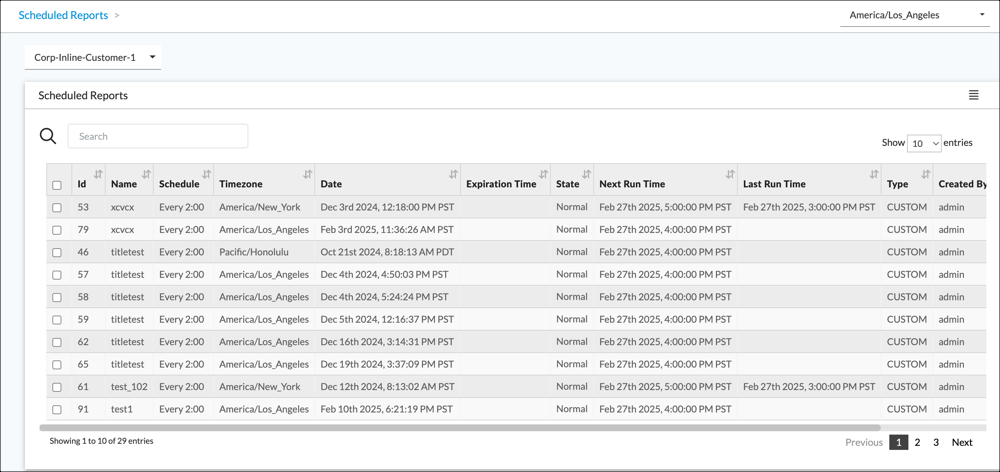
Field Description ID ID number of the entry for the current row (the current entry). Name Name of the template used to generate the scheduled report. Schedule Time specification of when the report is to be generated. Timezone Timezone. Date Date the current entry was added to the schedule. Expiration Time Time the current entry expires. State State of the current entry. Next Run Time Next time the current entry is scheduled to be run. Last Run Time Last time a report was generated using the current entry. Type (For Releases 22.1.1 and later) Report type:
- Custom
- Business
Created By Name of the user who added the entry to the schedule. Access (For Releases 22.1.1 and later) Access permission for reports generated from the template:
- Private—Tenant user who created the report and provider users with tenant access can view, edit, and delete the report.
- Shared—Any tenant user and provider users with tenant access can view, edit, and delete the report.
- Shared Read Only—Any tenant user and provider users with tenant access can view the report. Only the tenant user who created the report and provider users with tenant access can edit and delete the report.
Actions Click the  Trash icon to delete the current entry.
 - To delete one or more entries, click the box in the first column of each entry and then select the Delete option from the menu in the upper-right corner of the table.
- To edit the generation time for an entry:
- Click the box in first column for the entry.
- Select the Edit option from the menu in the upper-right corner of the table. The Rescheduling window displays.
- Follow Steps 5 through 8 in Schedule Custom Report Generation.
Manage Completed Reports
Completed reports are stored under the name of their template and assigned a unique ID. You can download a copy of the report in CSV or PDF format to your local system. You can delete completed reports.
To manage completed reports:
- In Director view, select Analytics > Reporting > Manage > Completed Reports.
- Select an organization from the drop-down list. The Completed Reports screen displays with the following fields.

Field Description ID ID number of the completed report. Name Name of the template used to generate the completed report. Date Date and time that the completed report was generated. Schedule The schedule entry used to generate the report. For example, the completed report with ID number C67754 was generated from the schedule entry for custom template Bengaluru-Office-4300-2, which is every 2 hours (2:00).
You can view the report generation schedule from the Scheduled Reports screen. For more information, see Manage the Report Generation Schedule, above.
Status (For Releases 22.1.1 and later.) Status of the report:
- Complete—Report was successfully generated.
- Complete (No data)—Report was successfully generated but contains no data.
- Error—An error was encountered when generating the report.
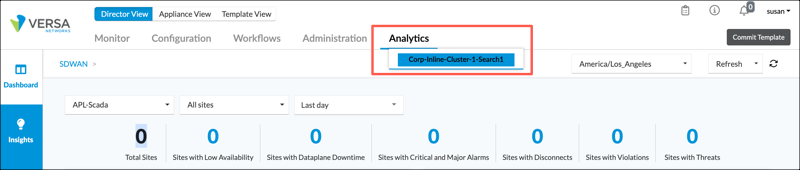
Processing Node (For Releases 23.1.1 and later.) Analytics node that generated the report from the template. Each node in an Analytics cluster runs an instance of the Analytics application. Reports can be generated using any of these instances. This field helps you to identify where the report was generated so that you can examine the logs on the node to search for errors and debug them.
Note: You access a specific instance of the Analytics application by selecting its node from the hover menu for the Analytics tab. In the following example, the hover menu displays node Corp-Inline-Cluster1-Search1.
Type Report type:
- Custom
- Business
Created By
(For Releases prior to 22.1.1, this field is Owner)
Username of account that scheduled the report. Access (Releases 22.1.1 and later.) Access permission for the report.
- Private—Tenant user who created the report and provider users with tenant access can view, edit, and delete the report.
- Shared—Any tenant user and provider users with tenant access can view, edit, and delete the report.
- Shared Read Only—Any tenant user and provider users with tenant access can view the report. Only the tenant user who created the report and provider users with tenant access can edit and delete the report.
- To download a CSV copy of a completed report, click the
 CSV icon in the Actions column. A system-specific window displays allowing you to save the information in a local file.
 - To download a PDF copy of a completed report, click the
 PDF icon in the Actions column. A system-specific window displays allowing you to save the information in a local file.
 - To delete completed reports, click the box in front of each report, and then select Delete from the menu in the upper-left portion of the screen.
Manage Document Design for Custom Reports
You can customize the following document parameters for custom reports:
- Report settings—Table settings, such as table font size.
- PDF settings—Base-document settings such as page headers and footers. These parameters are stored in a PDF template.
You use a custom template to define report contents, which are the tables and charts to include in the report. Then, when you save the custom template, you select a PDF template. Any PDF reports generated from the custom template use the base-document settings from the PDF template and the table settings displayed on the report settings screen.
To manage reporting settings and PDF templates:
- In Director view, select Analytics > Administration > Configuration > Settings.
- In the main pane, select the Reporting tab. The Report Settings display.
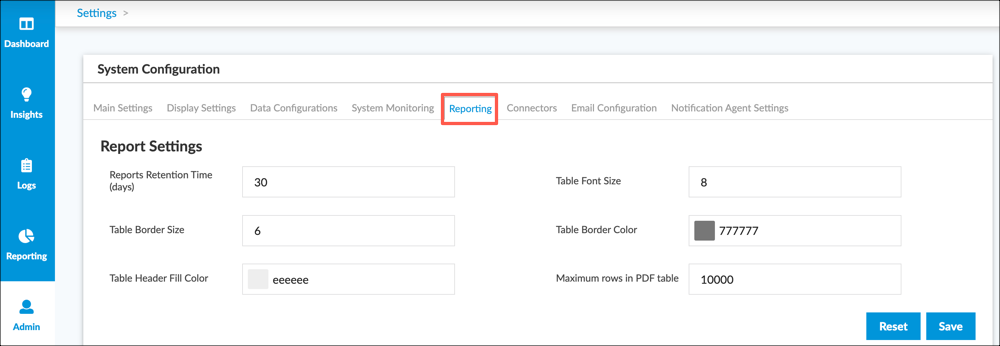
- Enter information for the following fields.
Field Description Table Font Size Font size for tables. Table Border Size Border size for tables. Table Border Color Border color, in hexadecimal notation. Table Header Filler Color Table filler color, in hexadecimal notation. Maximum Rows in PDF Table Maximum number of rows to include in any single table in the report. - Click Save.
- Scroll down to view the Custom Templates table.

Field Description ID Identification number assigned to the template. Tenant Name of the tenant or tenants for which the template can be used. Name Name of the template. File Name Name of the template file uploaded from the local system. You can view the template file by clicking a link in the File Name column. Active Availability status of the template. Active indicates that the template is available to generate reports. When a template is active, this box is shaded gray. When a template is inactive, this box is shaded white. Last Modified Date the template was last modified. This includes modifying the tenant, template name, and active status. - To delete a template, click the x icon in the row for the template.
- To upload a PDF template from your local system:
- Click the Add Templates icon to display the Template Upload popup window.

- Enter information for the following fields.
Field Description Template Type Select Custom. Template Name Enter a name for the template.
Tenant Select an individual tenant, or select All to allow the template to be used for all tenants.
Default: All
Upload a File Click Choose File, and then select a template file from your local system. Template Active Status Select to make the template active, or deselect to make the template inactive. When you mark the template as active, the template name is displayed in the PDF Template drop-down list on the Save and Schedule window when you save a custom template. - Click Upload.
- Click the Add Templates icon to display the Template Upload popup window.
- To modify the settings for an existing template, click the Actions icon in the row for the template. The Template Upload popup window displays. You can modify any field except the Tenant field.
To associate the PDF template with a custom report template, you select it from the drop-down list on the Save and Schedule screen when you save the template.
Supported Software Information
Releases 20.2.1 and later support all content described in this article except:
- Release 21.1.1 adds support for combining multiple appliances into a single area chart, line chart, or stacked bar chart; you can create a per-appliance report using a report template and apply it to other appliances; you can add a chart or table of report types Link Availability or Link Availability Over Time.
- Release 21.2.1 adds support for report type Application Usage per Type; you can add numeric comparison criteria to a filter; you can export logs from the preview area.
- Release 21.2.3 adds support for report types Tenant Usage for SD-WAN and Tenant Usage for DIA.
- Versa Networks cloud-hosted services adds support for many report types.
- Release 22.1.1 adds support for selecting individual statistics metrics. You can associate access permissions to a template.
- Release 22.1.4 adds support for the Appliance Usage reports, Tenant Usage reports, and the Subtenants field.
- Release 23.1.1 adds support for the reports wizard. Support is added for Cloud API Security reports. The Processing Node node field is added for the Completed Reports screen.