Configure SaaS Application Monitoring
![]() For supported software information, click here.
For supported software information, click here.
You configure software-as-a-service (SaaS) application monitoring to perform SD-WAN performance-based path selection. SaaS application monitoring checks each next hop for liveness and monitors application performance. While you can use performance-based path selection for any purpose, you typically use it in the context of selecting the best path to cloud-based SaaS applications.
In an SD-WAN network, a tenant or organization can reach a SaaS application using multiple WAN links. These WAN links can use different paths and even different transport networks. Because the transmission latency among different paths can vary, it is important to choose the best available path for optimal SaaS-application performance.
The Versa Operating SystemTM (VOSTM) traffic-steering software allows you to select the best forwarding path using the following methods:
- Passive application steering—Uses passively collected, single-ended application performance metrics. Single-ended deployments are ones that do not require another participating VOS device. Passive application steering is also known as inline application monitoring.
- Active application steering—Uses active performance monitoring data.
In deployment scenarios with direct internet access (DIA) connections, such as one with a single broadband link or multiple broadband links connected directly to a branch site, the best path to a SaaS application may be a direct connection from the branch, or it may be through a VOS device deployed as a cloud interconnection hub. The cloud interconnection hub can be deployed in a variety of locations, such as a customer data center, an internet interconnection or a hosting facility such as Equinix, or the SaaS provider’s data center. In addition, customers may require that all their internet traffic egress through one or more cloud security gateways, such as Zscaler.
The following figure shows a branch device that has direct internet access using WAN links from two providers, SP-1 and SP-2. These links are also part of the SD-WAN overlay that includes Hub 1, Hub 2, and other branches (not pictured).

When you enable passive application steering, VOS spoke and hub devices collect transport layer and application layer metrics for TCP-based SaaS application sessions as application traffic moves through the devices. These metrics include network and server response times and packet loss estimates in each direction. The VOS traffic-steering software uses these metrics to assess the quality of an application over different paths so that it can select the best path for the application. A path can be a direct internet access path (through a local WAN circuit) or an indirect path through a hub.
You can use passive SaaS application steering in the following scenarios:
- Most traffic uses a central breakout from a spoke to a hub, and only some traffic uses a local breakout.
- Most traffic uses a local breakout, and only some traffic uses a central breakout.
Note that passive application steering is generally used for SaaS applications, but it also works for any application that has more than one path to a destination. Here, a path is defined as a direct underlay path, such as one that uses the internet or MPLS, or an SD-WAN site. For example, you can configure passive steering for an application that has two SD-WAN sites as next hops, two internet underlays, or one internet underlay and one SD-WAN site. However, you cannot configure passive application steering for an application that is reachable only through one SD-WAN site.
To configure active SaaS application monitoring, you configure VOS devices to send HTTP, ICMP, and TCP probes. These active monitoring probes measure the responsiveness of commonly used cloud-based SaaS applications.
You can configure hubs to export both active and passive application-steering metrics to spoke sites over the MP-BGP control plane. Spoke sites then have two ways to derive application performance metrics for hub paths:
- Use only locally collected, passive end-to-end performance metrics.
- Combine metrics exported by hubs with SLA monitoring metrics towards the hubs.
The metrics are consolidated into a single score called the Versa link rank (VLR), which represents the application's performance. The VLR is a number from 0 (best performance) through 100 (worst performance). For each SaaS application and for each path, the VOS path selection software creates and regularly updates the recent history of the VLR to determine which path offers the best performance.
Configure Passive SaaS Steering
To enable passive SaaS steering, you configure an SD-WAN policy rule in which the match condition contains one or more applications from a predefined list of 25 or so commonly used SaaS applications, such as Office 365, Google applications, and Salesforce. You then associate the rule with a forwarding profile that you configure to automatically select the next hops to use to reach the applications. Then traffic for these applications is forwarded only to the configured next hops.
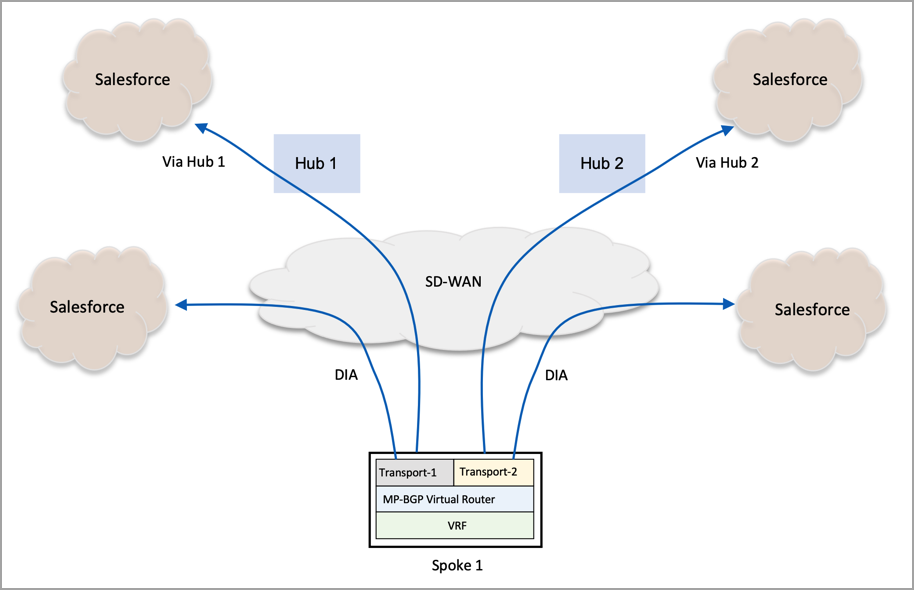
The following figure shows a deployment that uses passive SaaS application steering. In this figure, Spoke 1 uses passive steering to determine whether to use a DIA path to reach the Salesforce application or whether to send traffic through Hub 1 or Hub 2 to reach the application.
To configure passive SaaS application steering, you first configure an SD-WAN traffic-steering forwarding profile with the following next-hop information:
- Configure the next-hop selection method to be automatic.
- The forwarding profile must include at least two next hops that are assigned the same priority.
While you typically configure next hops in the forwarding profile, configuring them is not mandatory. If you do not configure next hops, passive application steering is done over paths discovered using route lookup. For example, if the destination is on the internet, and the default route is ECMP using two internet circuits (for example, internet1 and internet2), the internet1 and internet2 circuits are automatically used for passive path selection.
As the last steps, you configure a match condition and an enforcement action in an SD-WAN policy rule, and you associate the rule with the SD-WAN traffic-steering forwarding file.
Configure an SD-WAN Traffic-Steering Forwarding Profile
To configure an SD-WAN traffic-steering forwarding profile with the required next-hop information:
- In Director view:
- Select the Configuration tab in the top menu bar.
- Select Templates > Device Templates in the horizontal menu bar.
- Select an organization in the left navigation bar.
- Select a post-staging template in the main panel. The view changes to Appliance view.
- Select the Configuration tab in the top menu bar.
- Select Services > SD-WAN > Forwarding Profiles.

- Click the name of an existing forwarding profile, or click the
 Add icon.
 - In the Edit Forwarding Profile screen, select the Next Hop tab.

- In the Next-Hop Selection Method field, select Automatic
- In the Next Hop Priorities List table, configure at least two next hops that have the same priority. Click the + Add icon to display the Add Next Hop Priorities popup window.

- In the Name field, enter a name for the next hop.
- In the Priority field, enter a priority value.
- Click OK.
- Click the + Add icon again to create a second next hop and assign it the same priority as the first next hop. Then click OK.
- For information about configuring the other fields for the forwarding profiles, see Configure SD-WAN Traffic Steering.
- Click OK.
Configure the SD-WAN Policy Rule Match Condition
- In Director view:
- Select the Configuration tab in the top menu bar.
- Select Templates > Device Templates in the horizontal menu bar.
- Select an organization in the left navigation bar.
- Select a post-staging template in the main panel. The view changes to Appliance view.
- Select the Configuration tab in the top menu bar.
- Select Services > SD-WAN > Policies in the left menu bar, and then select Rules in the horizontal menu bar.
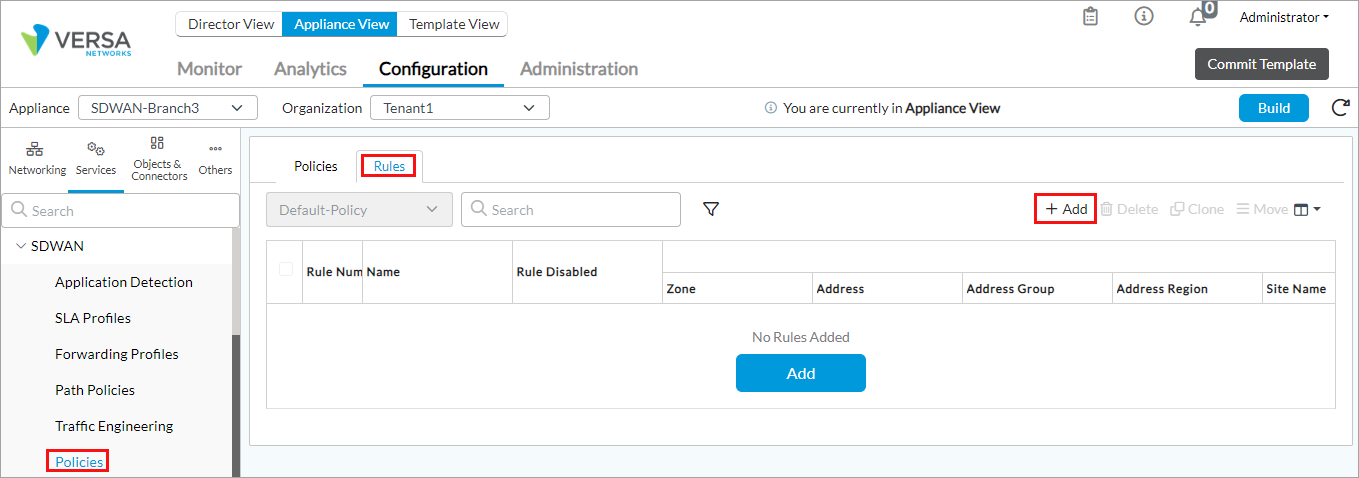
- Click the + Add icon to add a rule. The Add Rules popup window displays.
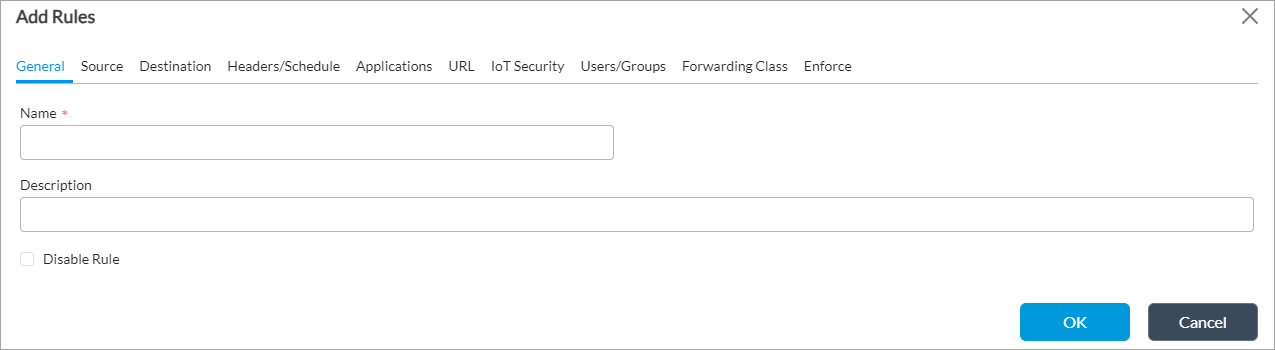
- Select the General tab, and in the Name field, enter a name for the rule.
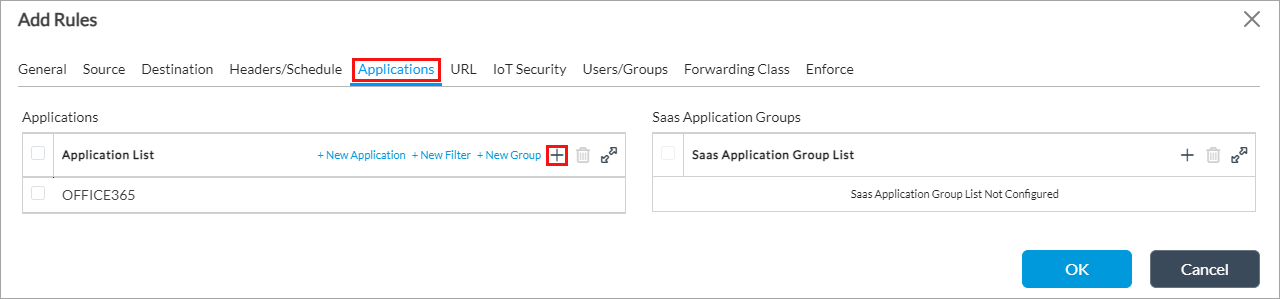
- Select the Applications tab, the click the + Add icon in the Applications table and select one or more predefined applications. The following screenshot shows that Office365 is the selected application.
Associate the Policy Rule with a Forwarding Profile
- Select the Enforce tab in the Add Rules popup window.

- In the Forwarding Profile field, select the SD-WAN traffic-steering forwarding profile to apply to traffic that matches the rule.
- Click OK.
Configure Active SaaS Application Monitoring
Active SaaS application monitoring collects performance metrics about an organization's or a tenant's WAN links and uses the metrics to help determine the best path to a SaaS application.
In an SD-WAN deployment, there are two ways to reach a SaaS application:
- Directly, from a branch to the SaaS application in the cloud. This is called local breakout. In this case, the application monitor actively measures the performance of the local WAN links to determine the best path to the application.
- Indirectly, through a hub in a hub-and-spoke topology. This is called remote breakout. In this case, the application monitor collects the performance metrics at the hub and exports them to its connected spokes. The spokes then combine the performance metrics received from the hub with branch-to-branch SLA metrics to determine the best path to the application.
You can use active monitoring SaaS path selection for any SaaS application, not just predefined ones. You can use a single SaaS application monitor to track multiple fully qualified domain names (FQDNs) over multiple WAN links, and the collected metrics can be used by, or be exported to, multiple tenants. In multitenant SD-WAN deployments, WAN links are associated with and owned by the provider organization, and can be used by multiple customer tenants. In this case, the provider organization monitors the FQDNs, but multiple customer tenants use the collected metrics.
To track the next hops for SaaS applications, VOS devices use ICMP monitor probes. VOS devices use TCP and HTTP monitor probes. TCP and HTTP monitor probes are often more reliable probes for determining the optimal path for internet traffic. ICMP monitor probes are often less reliable in providing reachability and performance metrics, because network policies often throttle or drop these probes.
TCP monitor probes work by initiating a session and then immediately tearing it down gracefully. This sequence is repeated regularly, at a configured monitoring interval, which is the length of time between monitoring events. If a session is not established within the threshold limits configured for the probe, the monitor is considered to be down..
HTTP monitor probes use the underlying TCP probe infrastructure and also send a HEAD request before tearing down the TCP session. The HTTP HEAD request reply time is used to calculate the time-to-first-byte (TTFB) metric or server response time, and an HTTP response code is used to determine the status of the monitor. Latency and loss are calculated according to the underlying TCP probe infrastructure.
The following figure shows a deployment that uses active monitoring from hubs. Here, Spoke 1 actively monitors the performance of the Salesforce application over its local internet circuits, Transport 1 and Transport 2. Hub 1 and Hub 2 actively monitor application performance over their own local internet circuits, and they export the metrics to Spoke 1 and to other spoke sites in the same network. The spokes then compare the end-to-end metrics for the Salesforce application over each path and they then select an appropriate path.

You can configure application monitors in several ways depending on your use case. Typical use cases include:
- Use the best metrics available from a remote breakout—In this case, you configure application monitors on a hub and export the collected metrics from the hub to spoke devices. Spokes can combine the metrics with site-to-site SLA metrics to determine the best path to use to direct traffic to a SaaS application using remote-breakout nodes (hubs).
- Use the best metrics available from a local breakout and a remote breakout—In this use case, you add the hub configuration mentioned in the preceding bullet (direct internet traffic based on the best metrics available from a remote breakout) to the spoke device's configuration. During path selection, both locally collected metrics and metrics received from the remote hubs are compared to determine the best path to a SaaS application.
- Use the best metrics available from multiple local breakouts—In this case, you configure an application monitor to track a given FQDN using multiple local internet routing instances. During path selection, the locally collected metrics from all available internet routing instances are compared to determine the best path to a SaaS application.
A typical process for configuring application monitors is as follows:
- Configure one or more application monitors on the hub and spokes in a hub-and-spoke topology.
- Create one or more SLA profiles that specify which application monitor to use and the SLA thresholds for loss and latency.
- Create one or more forwarding profiles that use the SLA profile.
For Releases 22.1.3 and later, you can use traceroute to monitor SaaS applications. You can configure the interval at which traceroute messages are sent when the monitor is in the Up and Down states.
Add a SaaS Application Monitor
To configure application monitors on the hub and spokes in a hub-and-spoke topology:
- In Director view:
- Select the Administration tab in the top menu bar.
- Select Appliances in the left menu bar.
- Click the appliance in the main pane. The view changes to Appliance view.
- Select the Configuration tab in the top menu bar.
- Select Networking > SaaS App Monitor in the left menu bar.
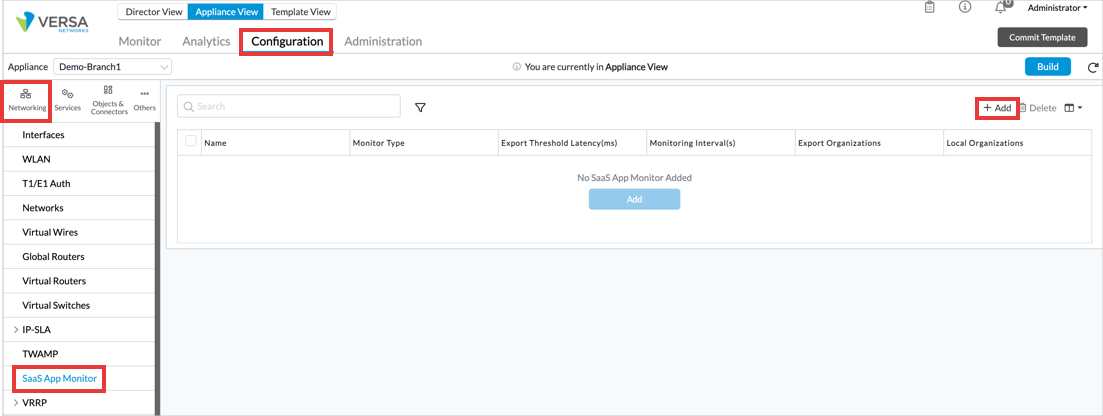
- Click the Add icon. In the Add SaaS Application Monitor popup window, enter information for the following fields.

Field Description Name (Required) Enter a name for the SaaS application monitor. Monitor Type (Required) Select a monitor type:
- HTTP
- ICMP
- TCP
Monitoring Threshold Enter a value for the monitoring threshold, which indicates the number of consecutive monitor probes lost (or with no response) before declaring the application monitor down.
Range: 1 through 60
Default: 5
Monitoring Intervals Enter how often, in seconds, to send monitoring probes.
Range: 1 through 60 seconds
Default: 3
Destination Port (Required) Enter number of the destination port on which the application monitor is located. The destination port is required for HTTP and TCP monitors.
Range: 0 through 65535
Default: None
Predefined SaaS Group (Required) (For Releases 22.1.1 and later.) Select a predefined SaaS application group. Note that this option is grayed out if you enter an FQDN or IP host address.
FQDN/Host Address
(For Releases 22.1.1 and later.) Enter the host's FQDN or IP address. Note that this option is grayed out if you select a predefined SaaS group. Default LEF Profile (For Releases 22.1.1 and later.) Click to export SaaS application monitoring logs to the default LEF profile destination. When you select this option, logs are generated every 5 minutes. Analytics dashboards refer to SaaS application monitoring as active APM. For information about configuring a default LEF profile, see Configure a LEF Profile. Networks (For Releases 23.1.1 and later.) Select a network in order to monitor SaaS applications from a single routing instance but through multiple interfaces. Response Codes Click the
Add icon, then select one or more response codes. For the HTTP monitor type, displays a list of expected response codes from the HTTP HEAD request. A monitor is declared down if the received response code does not match one in a response code in this list.Export Organizations Click the
Add icon, then select one or more organizations to which application metrics are exported.Local Organizations (Required) Click the Add icon to select one or more local organizations that use the metrics collected by the application monitor.Routing Instances (Required) Click the Add icon to select one or more routing instances from which the SaaS application is monitored.Response Code Ranges (Required) For the HTTP monitor type, enter a low range and a high range of response codes instead of using a list of specific response codes.
Range: 1 through 600 (for both low and high ranges)
Default: None
Export Threshold (Group of Fields) - Export Threshold Latency
Enter a latency change time, in milliseconds, to reach before the application monitor exports a new latency metric. For example, if the application monitor measures the latency as 10 milliseconds, with the default export threshold of 5 milliseconds, the metric is updated and exported when the latency reaches 15 milliseconds (10 + 5).
Range: 1 through 60 milliseconds
Default: None- Export Threshold Loss
Enter the amount of loss, as a percentage, to reach before the application monitor exports a new latency metric.
Range: 0 through 100 percent
Default: None
Traceroute (Group of Fields) (For Releases 22.1.3 and later.) Enter the frequency with which traceroute requests are sent.
- Up Interval
Enter the traceroute repeat interval when the monitor state is in Up, in minutes. To disable traceroute when the monitor is Up, configure an interval value of 0.
Range: 0 through 10080 minutes
Default: None
Recommended Value: 60 minutes (1 hour)- Down Interval
Enter the traceroute repeat interval when the monitor state is in Down, in minutes. To disable traceroute when the monitor is Down, configure an interval value of 0.
Range: 0 through 10080 minutes
Default: None
Recommended Value: 15 minutes - Click OK.
Reference the SaaS Application Monitor in an SLA Profile
You can create one or more SLA profiles that specify which application monitor to use and that specify SLA thresholds for loss and latency.
For information about configuring SLA profiles, see Configure SLA Profiles for SD-WAN Traffic Steering.
To reference an SaaS application monitor in an SLA profile:
- In Director view:
- Select the Administration tab in the top menu bar.
- Select Appliance in the left menu bar.
- Click the appliance in the main pane. The view changes to Appliance view.
- Select the Configuration tab in the top menu bar.
- Select Services > SD-WAN > SLA Profiles in the left menu bar.
- Click the + Add icon. The Add SLA Profile popup window displays.
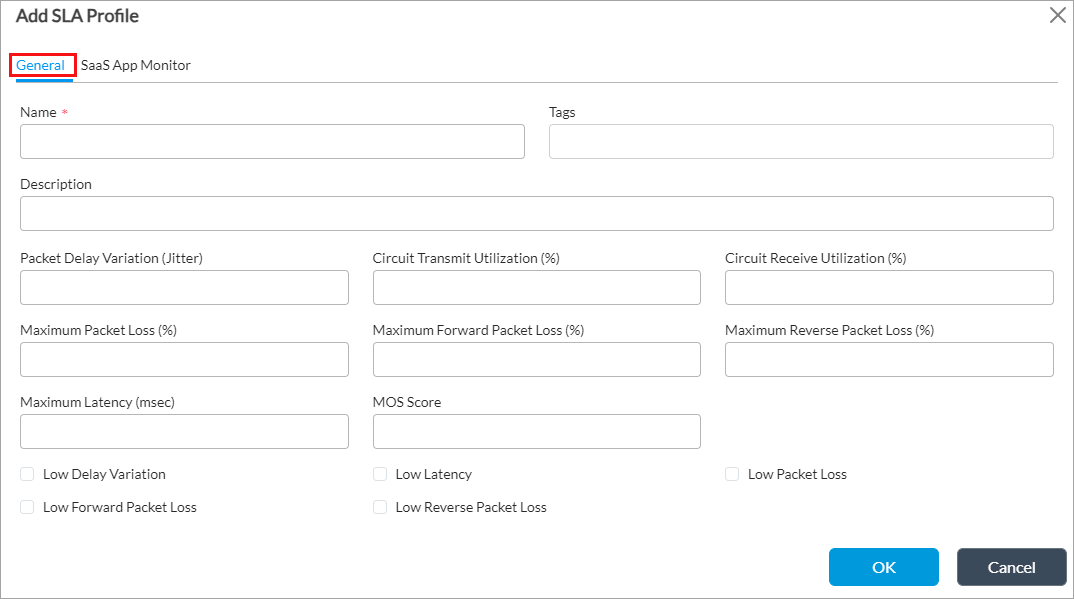
- In the General tab, enter the name of the SLA profile in the Name field.
- In the SaaS App Monitor tab, enter information for the following fields.
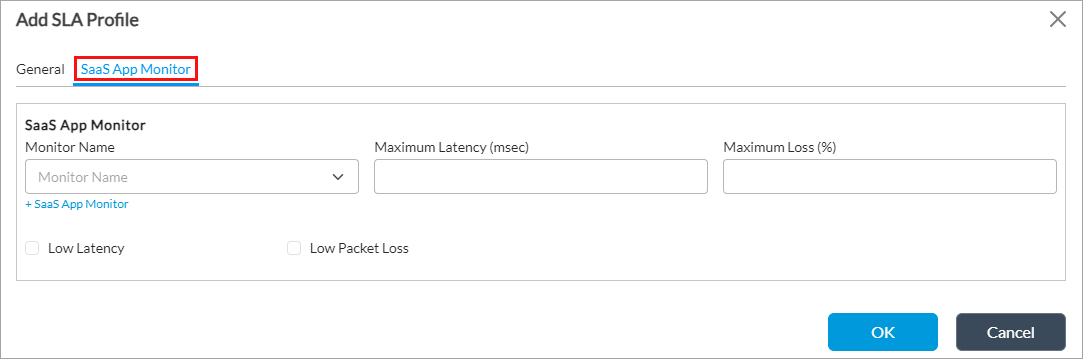
Field Description Monitor Name Select the name of the SaaS application monitor from the list of all locally configured SaaS application monitors. To choose a SaaS application monitor that has been configured on a remote site, such as a hub, enter the name of the monitor. For cases in which the path must be selected from a mix of local and remote breakouts, ensure that a SaaS application monitor with the same name is configured both locally and on the hub(s). Maximum Latency Enter the maximum latency for the SLA, in milliseconds. If the latency value is exceeded, the link has violated the SLA. Maximum Loss (%) Enter the maximum loss percentage for the SLA. If the percentage value is exceeded, the link has violated the SLA. Low Latency Click to enable low latency for the SLA profile. Low Packet Loss Click to enable low packet loss for the SLA profile. - Click OK.
Reference the SLA Profile in a Forwarding Profile
You can associate the SLA profile with a forwarding profile in two ways:
- Global application monitor—You configure an SLA profile globally using the application monitor configuration. The application monitor configuration applies to all next hops that are defined in the next-hop priorities (assuming that no SLA profile is associated with the defined next hops). If you do not define the next-hop priorities, configuring the application monitor globally helps to generate automatic next-hop priorities based on local and remote application monitor results. If you define next-hop priorities, all autogenerated next hops are considered to be priority 1, unless the application monitor metrics detect an SLA violation.
- Next-hop–specific application monitor—You define next-hop priorities in forwarding profiles to explicitly configure the next hops for a given flow. You can also include an SLA profile in the next-hop priorities configuration to qualify the next-hop selection. The status of the application monitor (Up or Down) determines whether to use the next hop, even if it has a higher priority. By defining the SLA threshold, you can either keep the next hop in the configured priority or move it to the SLA-violated priority.
For information about configuring a forwarding profile, see Configure SD-WAN Traffic Steering.
To reference an SLA profile in a forwarding profile:
- In Director view:
- Select the Administration tab in the top menu bar.
- Select Appliance in the left menu bar.
- Click the appliance in the main pane. The view changes to Appliance view.
- Select the Configuration tab in the top menu bar.
- Select Services > SD-WAN > Forwarding Profiles in the left menu bar.
- Click the + Add icon. The Add Forwarding Profile popup window displays.

- Select the General tab, and enter information for the following fields:
- In the Name field, enter a name for the new forwarding profile.
- In the SLA Profile field, choose the SLA profile that you configured earlier. Note that the forwarding profile does not explicitly contain next-hop information. Rather, the next hops are derived automatically from the application monitor data based on one or both of the following:
• Transport VRs, which are used if the SLA profile refers to a locally configured (local breakout) application monitor
• Remote sites, which are used if the SLA profile refers to a remotely configured (remote breakout) application monitor
- Click OK to apply the parameters defined in the SLA profile globally. Otherwise, continue with Step 7 to manually configure next hops.
- Select the Nexthop tab.

- Click the + Add icon to add next-hop priorities. In the Add Nexthop Priorities popup window, enter information for the following fields.
Note that you can select only one of the Address, Site Name, or WAN Network options. You cannot select more than one.
Field Description Name (Required) Enter a name for the next hop. Priority (Required) Select the priority value of the next hop.
Values: 1 through 4Address (Group of Fields) If you click Address, complete the following fields: - Next-Hop IP Address
Enter the IP address of the next hop. This next-hop address takes precedence over the global next-hop addresses in the SLA profile. - Routing Instance
Select the routing instance to use to reach the next hop. Site Name If you click Site Name, then select the name of the VOS device to associate with the next hop. WAN Network If you click WAN Network, then select the name of the WAN network to use to reach the next hop. Monitor Select the name of the monitor to associate with the next hop.
Monitor Group Select the name of the monitor group to associate with the next hop. SLA Profile Select the name of an SLA profile. +SLA Profile Add an SLA profile. For more information, see Configure SLA Profiles for SD-WAN Traffic Steering. - Click OK.
- Click OK in the Add Forwarding Profile popup window.
View SaaS Application Analytics Dashboard
For Releases 22.1.1 and later.
You can view SaaS application analytics from the Active APM tab of the device details dashboard.
To view the device details dashboards, select Analytics > Dashboard (Home) ![]() > Dashboards > SD-WAN, and then in the third drop-down menu select an individual VOS device to display the device details dashboard.
> Dashboards > SD-WAN, and then in the third drop-down menu select an individual VOS device to display the device details dashboard.
From the device details dashboard, select APM > Active APM to display the following items:
- Active Application Monitoring Over Time of device (chart)
- Active Application Monitoring Metrics of device (table)

Supported Software Information
Releases 20.2 and later support all content described in this article, except:
- Release 20.2 adds support for SD-WAN policies if the route points to a VPN or an non-VPN destination, and you can specify multiple next hops in a forwarding profile.
- Release 20.2 adds support for active SaaS application monitoring.
- Release 20.2.1 adds support for TCP and HTTP monitor probes.
- Release 22.1.1 adds support for export of SaaS application monitoring logs and the Active APM dashboard.
- Release 22.1.3 supports using traceroute to monitor SaaS applications.
- Release 23.1.1 supports the Networks option when configuring a SaaS application monitor.