Configure SLA Monitoring for SD-WAN Traffic Steering
![]() For supported software information, click here.
For supported software information, click here.
SLA monitoring allows Versa Operating SystemTM (VOSTM) devices to monitor the performance of the data paths between each pair of VOS branch devices. SLA monitoring uses active probes and the data packets sent between the branches to calculate delay and metrics. An SD-WAN traffic-steering policy uses the SLA metrics to steer traffic between branches, and it uses the information from these packets to optimize the overhead between branches. Note that Controller nodes do not participate in the data path (they send control traffic only), so you cannot use SLA monitoring with Controller nodes.
VOS devices can perform two types of SLA monitoring:
- Continuous SLA monitoring—Continuously monitors the performance of paths between peer branches. Continuous SLA monitoring is enabled by default. For smaller network topologies, including full-mesh topologies, the number of paths being monitored is not large, and the circuits between branches are generally able to handle the number of probes being sent. A smaller network topology might be one with ten branch devices, each with one link, configured in a full-mesh topology. Here, each branch monitors nine paths by sending probes every 2 seconds.
- Adaptive SLA monitoring—Continuously monitors the performance of paths only to neighbors that are actively passing traffic. For inactive neighbors, adaptive SLA monitoring significantly places them into the suspend state. When a neighbor is in this state, no SLA monitor packets are sent to it.
Adaptive SLA monitoring is useful for larger topologies, especially larger full-mesh topologies that have slower WAN links. For example, a larger topology might consist of 200 branches in an Active/Active configuration, each with two tenants. This means that each device has two links, and so there are four possible paths to any other device in the network (two paths via local WAN links and two paths via the HA device). For this topology, a VOS device needs to monitor paths toward 398 devices (200 branches with 2 devices in each of them), which results in 3184 probes being sent every 10 seconds (398 x 4 x 2). Larger devices with high-capacity WAN links can handle this number of probes, but smaller devices with lower-capacity links, such as T1 links, may be overwhelmed by the probe traffic.
Note: A local WAN link failure results in instantaneous detection. The SLA for that link is immediately declared down, and the process of initiating path selection from anomaly detection to switching paths is done within a sub-millisecond interval. If an SDWAN path is down due to anomalies or brownout scenarios in intermediate nodes between two sites, the total time for path selection, from anomaly detection to switching paths, is 300ms.
VOS devices can also perform data-driven SLA monitoring to regulate the amount of monitoring traffic between branches. You configure data-driven SLA monitoring as part of an SD-WAN path policy, not as part of an SD-WAN traffic-steering policy. For more information, see Configure Data-Driven SLA Monitoring.
Configure Continuous SLA Monitoring
VOS branch devices continuously monitor the performance of all paths towards all SD-WAN peer branches. A branch-to-branch path is defined as any valid transport tunnel between the two branches. For example, if two branches each have two broadband links and all the links are in a single transport domain then, there are four paths between the two branches. To monitor each path, the VOS devices sends request-response style SLA probes regularly. The forwarding class is considered when sending the SLA probes, because different forwarding classes receive differentiated treatment.
The SLA probe protocol is an extension of ITU Y1731/CFM.
The SLA probes provide information that allows the VOS device to compute metrics for delay, forward and reverse delay variation, and loss (statistical and actual traffic loss in the forward and reverse directions). VOS devices store metrics in a rolling five-minute window. VOS devices use the metrics as input to the path-selection process, and they periodically export them to Versa Analytics. You can use Analytics APIs to write sophisticated visibility and control applications.
You can configure SLA monitoring for all 16 forwarding classes (network control through forwarding class 15). However, it is recommended that you configure SLA monitoring only for the four commonly used forwarding classes (which map to the four common behavior aggregates on IP networks)—network control (NC), expedited forwarding (EF), assured forwarding (AF), and best effort (BE).
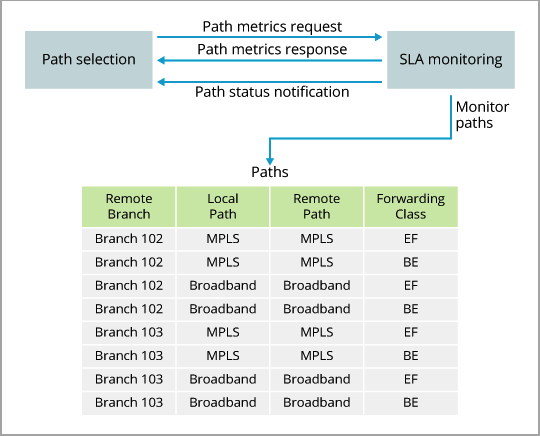
The following figure illustrates the data flow between VOS SLA monitoring and path selection.
The SLA loss-measurement protocol measures two types of traffic loss:
- Statistical loss—This measurement is based on the loss of SLA protocol data units (PDUs) on the SD-WAN path during the measurement interval. SLA PDUs are synthetic data PDUs, and they are used to measure loss even if there is no customer traffic. However, because the loss-measurement protocol requires that the SLA PDUs themselves be dropped, the loss measurement is not granular and may not be able to detect small losses reliably and quickly.
- Inline loss—This proprietary measurement measures customer traffic loss on the SD-WAN path in the forward and reverse directions. If traffic is flowing on the path, inline loss can detect losses of less than 1 percent. SLA PDUs carry traffic-usage information from the destination branch back to the source branch so that the source branch can compute the inline forward-and-reverse loss ratio.
A combination of statistical loss measurement and inline loss measurement is used to accurately and reliably detect packet loss in the network.
By default, continuous SLA monitoring is enabled, and it uses three parameters that are applied to each forwarding class:
- Interval—How often to send SLA probes on each path between the branch nodes. The default is 2,000 milliseconds (2 seconds).
- Logging Interval—How often to log SLA measurements for each path to the Analytics node. The default is 300 seconds. Logs are sent to the active collector of the default LEF profile. For information about configuring a default LEF profile, see Configure Log Export Functionality.
- Loss Threshold—Number of consecutive SLA probes that must be lost for the path to be declared inactive. The default is 3.
Note that you can use SLA monitoring only to control SLA probes. You cannot apply firewall or QoS rules to SLA traffic egressing from the VOS device.
To change the default SLA monitoring values:
- In Director view:
- Select the Configuration tab in the top menu bar.
- Select Templates > Device Templates in the horizontal menu bar.
- Select an organization in the left navigation bar.
- Select a post-staging template from the main panel. The view changes to Appliance view.
- Select the Configuration tab in the top menu bar.
- Select Services > SD-WAN > Path Policies in the left menu bar.
- In the main pane, click the name of a path policy. The Edit Path Policy popup window displays.
- In the Terms List table, click a term name. The Edit Terms popup window displays.

- Select the Action tab. In the SLA Monitoring group of fields, enter information for the following fields.
Field Description SLA Monitoring (Group of Fields) - Interval
Enter how often to send SLA probes on each path between the branch nodes.
Range: 100 to 300000 milliseconds
Default: 2000 milliseconds- Logging Interval
Enter how often to log SLA measurements for each path to the Analytics node
Range: 0 through 1800 secondsDefault: 300 seconds
- Loss Threshold
Enter the number of consecutive SLA probes that must be lost for a path to be declared inactive.
Default: 3Forwarding Class (Group of Fields)
Select the forwarding class or classes that the SLA monitoring configuration applies to. - FC General Configuration
Click the  Add icon, and then select one or more predefined forwarding classes.
- FC Specific Configuration
Click the Add icon to define a specific forwarding class configuration. To create a forwarding class, see Configure SD-WAN Path Policies. - Click OK.
- Click OK in the Edit Path Policy popup window.
Configure Adaptive SLA Monitoring
With the default continuous SLA monitoring, all paths between peer branches are continuously monitored. For a full-mesh topology with a large number of branches, this can result in a considerable amount of SLA traffic. Adaptive monitoring performs SLA monitoring only to neighbors that are actively passing traffic, which helps reduce the amount of SLA monitoring traffic on the network.
Adaptive SLA monitoring uses two parameters that are applied to each forwarding class:
- Inactivity interval—How long a neighbor is inactive before the VOS device changes the path's state from active to suspend. In the suspend state, the VOS device stops sending SLA monitor packets to the neighbor.
- Suspend interval—How long the path remains in the suspend state. After this time expires, the VOS device resumes sending SLA monitor packets to the neighbor.
Adaptive SLA monitoring works as follows:
- The VOS device sends SLA probe packets at the interval configured for continuous SLA monitoring, which is every 10 seconds by default. At this point, the monitoring state is active. The VOS device logs SLA metrics to the Analytics node.
- If the VOS device detects no activity on a path to a neighboring branch, it suspends use of the path and stops sending SLA probe packets on that path. While the path is suspended, the VOS device does not log SLA metrics to the Analytics node.
- If the VOS device detects any traffic to a neighbor whose path is suspended before the suspend interval expires, the path state changes to active monitoring, and the VOS device resumes sending SLA probe packets and resumes logging SLA metrics.
- If the VOS device detects any traffic to a neighbor whose path is suspended and the suspend interval expires, the VOS device resumes sending SLA probe packets on the path and resumes sending SLA metrics.
To configure adaptive SLA monitoring:
- In Director view:
- Select the Configuration tab in the top menu bar.
- Select Templates > Device Templates in the horizontal menu bar.
- Select an organization in the left navigation bar.
- Select a post-staging template in the main panel. The view changes to Appliance view.
- Select the Configuration tab in the top menu bar.
- Select Services > SD-WAN > Path Policies in the left menu bar.
- Click the + Add icon to create a new path policy. The Add Path Policy popup window displays.
- Select the Match tab, and enter a name for the path policy in the Policy Name field.
- Click the Add icon to create a term. The Add Terms popup window displays.

- Select the Match tab, and in the Term Name field, enter a name for the term.
- Select the Action tab, and click Adaptive SLA Monitoring to enable adaptive SLA monitoring. Enter information for the following fields.

Field Description Adaptive SLA Monitoring (Group of Fields) Click to enable adaptive SLA monitoring. - Inactivity interval
Enter how long the path to a neighbor is inactive before VOS device switches the path to the suspend state. In this state, the VOS device stops sending SLA monitor packets to the neighbor.
Range: 1 through 9000 seconds
Default: 300 seconds
- Suspend interval
Enter how long the path remains in the suspended state. After this time expires, the VOS device resumes sending SLA monitor packets on the path to the neighbor. Range: 1 through 9000 seconds
Default: 30 seconds
Forwarding Class (Group of Fields)
Select the forwarding class or classes that the adaptive SLA monitoring configuration applies to. - FC General Configuration
Click the Add icon, and then select one or more predefined forwarding classes.- FC Specific Configuration
Click the Add icon to define a specific forwarding class configuration. To create a forwarding class, see Configure SD-WAN Path Policies. - Click OK.
- Click OK in the Add Path Policy popup window.
Apply Path Policies
For SLA monitoring to work, you apply path policies to each individual WAN interface. Each of the WAN interfaces uses the path policy to learn how to send SLA traffic toward other branches.
In Releases 22.1.1 and later, an SD-WAN device can have up to 15 WAN interfaces. In Releases 21.2 and earlier an SD-WAN device can have up to 8 WAN interfaces.
To apply path policies to an interface:
- In Director view:
- Select the Configuration tab in the top menu bar.
- Select Templates > Device Templates in the horizontal menu bar.
- Select an organization in the left navigation bar.
- Select a post-staging template in the main panel. The view changes to Appliance view.
- Select the Configuration tab in the top menu bar.
- Select Services > SD-WAN > Site in the left menu bar.
- Click the Edit icon.

- The Edit Site popup window displays. The WAN Interfaces table lists the WAN interfaces available for the current tenant. Each tenant has its own SLA monitoring policies and available WAN interfaces. Select the path policy or change to the desired policy. Note that if you completely remove a path policy from a WAN interface, the WAN interface does not send any SLA probes to remote branches, and it always considers all paths to be up even when they are down.

- Click OK.
Monitor SLA Monitoring
To display the SLA monitoring state and metrics, issue the following CLI commands:
admin@Branch1-cli> show orgs org organization-name sd-wan sla-monitor path status
admin@Branch1-cli> show orgs org organization-name sd-wan sla-monitor path metrics
The path status can be one of the following states:
- Active—Path is actively sending SLA packets.
- Disable—Adaptive monitoring is not enabled for the path.
- Suspend—No activity is detected on the path.
- Suspend Retry—After the suspend state expires, PDUs are sent to determine whether the path is active. If the path is still inactive, it returns to the suspend state.
Supported Software Information
Releases 20.2 and later support all content described in this article, except:
- Releases 20.2.1 and later add support for configuring SLA monitoring using Director UI screens.