View Security Analytics Data (NGFW)
![]() For supported software information, click here.
For supported software information, click here.
SD-WAN branches, hubs, and controllers generate logs and events that Analytics nodes use to display information related to the network security provided by next-generation firewall (NGFW) features. To capture the traffic to be monitored and analyzed by Analytics nodes, you configure policy rules on Versa Operating SystemTM (VOSTM) devices. The policy rules are associated with LEF profiles that indicate the IP address, protocol, and port to send traffic logs. For more information about associating LEF profiles with features and services, see Apply Log Export Functionality.
This article describes the Security dashboards, which are located at Analytics > Dashboards > Security:
- Top-level Security dashboard—Displays summary statistics about NGFW security.
- Applications dashboard—Displays TCP application usage.
- Web dashboard—Displays URLs and URL reputations.
- Identity dashboard—(Releases 21.2 and earlier) Displays device identity statistics.
- IoT—(Releases 22.1.1 and later) Displays internet of things (IoT) statistics.
- Firewall dashboard—Displays firewall statistics.
- Threats dashboard—Displays threat detection statistics.
- DLP dashboard—(Releases 22.1.3 and later) Displays data loss prevention statistics.
For general information about how to use an Analytics dashboard, see View Analytics Dashboards and Log Screens.
Top-Level Security Dashboard
To view summary statistics about NGFW security features, select the top-level Security dashboard, at Analytics > Dashboards > Security.
The top-level Security dashboard displays the following charts:
- Top Applications
- Top URL Categories
- Top Bandwidth Consuming Applications
- Top Rules
- Top Destination Addresses
- Top Source Addresses
- Top Zone
- Firewall actions
- Top Threat Types

Applications Dashboard
The VOS software supports and automatically recognizes more than 3000 applications based on their signatures. The software uses deep-packet inspection (DPI) to identify applications, and the firewall software uses IP addresses and port numbers to enforce policies. The use of IP addresses and port numbers is based on the assumption that users connect to the network from a fixed location and access particular resources using specific port numbers.
Each application is associated with attributes, such as family, subfamily and tags. You can also create custom applications, application groups, and dynamic application filters. The Analytics node provides visibility into predefined and custom applications and application groups, and you can define dynamic application filters.
The Applications dashboard provides a summary of statistics about NGFW security features. To view the Applications dashboard, select Analytics > Dashboards > Security > Applications.
The Applications dashboard has the following tabs in the horizontal menu bar:
- Applications
- Risk
- Productivity
- Families
- Subfamilies
Applications
To view statistics about applications affected by NGFW filtering profiles, select Analytics > Dashboards > Security > Applications.
The dashboard displays the following charts and table:
- Top Applications By Sessions—Displays information about top applications by session.
- Application Usage Over Time By Bandwidth—Displays application bandwidth over time.
- Applications—Displays application statistics, including the number of sessions running that application, the amount of received and transmitted traffic by volume (in bytes) and bandwidth for the application, and the total bandwidth that an application is using.

To view application usage, in either the Top Applications chart or the Application table, click an application name. For example, clicking DNS displays the following:

Risk
To view traffic statistics by risk level, select Analytics > Dashboards > Security > Applications > Risk.
The Risk dashboard displays the Application Risks table.

To view statistics for a risk level, click a risk level. Risk Level 1 (Low Risk) is the lowest-level risk, and Level 5 (Very High Risk) is the highest-level risk.
For example, clicking Low Risk displays the following:

Productivity
To view traffic usage per productivity level, select Analytics > Dashboards > Security > Productivity.
The dashboard displays the Application Productivity table.

To view statistics for a productivity level, click a level number. For example, clicking level 2 displays the following:

Families
To view traffic usage for application families, select Analytics > Dashboards > Security > Applications > Families.
The screen displays the Application Families table.

To view statistics for an application family, select the family in the table. For example, clicking business-system displays the following:

Subfamilies
The Subfamilies tab displays traffic usage for application subfamilies.

To view statistics for an application subfamily, select the subfamily in the table. For example, clicking encrypted displays the following:

Web Dashboard
The Web dashboard displays statistics about URL activity for an organization. To view the Web dashboard, select Analytics > Dashboards > Security > Web.
The Web dashboard has the following tabs in the horizontal menu bar:
- URL Categories
- URL Reputations
URL Categories
The URL Categories tab displays traffic usage by URL category. You can view the following items in the URL Categories dashboard:
- URL Category Usage Over Time
- URL Category Usage—Displays details for each URL category, including:
- Number of sessions using that URL category
- Amount of received and transmitted traffic by volume (in bytes) and bandwidth for the URL category
- Total bandwidth that a URL category is using

To view statistics for a category, in the URL Category Usage table, click a URL category name. For example, clicking the Computer and Internal Security URL category displays the following:

URL Reputation
The URL reputation tab displays traffic usage by URL reputation. You can view the following items on the URL Reputations dashboard:
- URL Reputation Usage Over Time
- URL Reputation Usage

To view event statistics for a reputation, in the URL Reputation Usage table, select the reputation. For example, clicking suspicious displays the following screen.

Identity Dashboard
For Releases 21.2 and earlier.
The Identity dashboard displays NGFW device identity statistics. To view the Identity dashboard, select Analytics > Dashboards > Security > Identity.
The Identity dashboard displays the following items:
- Top Device Type
- Top Device Vendor
- Top Device Model
- Device Details

IoT Dashboard
For Releases 22.1.1 and later.
The IoT dashboard displays statistics about IoT devices. To view the IoT dashboard, select Analytics > Dashboards > Security > IoT.
The IoT dashboard displays the following items:
- IoT statistics block
- Total Devices—Count of IoT devices for the time period listed in the third drop-down list.
- Devices with Threats—Count of IoT devices with threats for the time period listed in the third drop-down list.
- Top Device Vendors
- Top XOT Categories
- Top Risk Categories
- Top Router Devices
- Top Device Types
- Top Device Tags
- Top Device OS
- Top Device Model
- Top Device Model Usage
- Details table

Firewall Dashboard
The Firewall dashboard displays information about NGFW firewall statistics and analytics. To view the Firewall dashboard, select Analytics > Dashboards > Security > Firewall.
The Firewall dashboard displays the following items:
- Rules
- Source
- Destination
- Zones
- Forwarding Class
Rules
To view rule usage for rules configured in security access policies, select Analytics > Dashboards > Security > Firewall > Rules.
The Rules dashboard displays the following items:
- Rule Usage Over Time
- Rule Usage

To view statistics for a rule in the Rule Usage table, click a rule name. For example, clicking the Allow-From-SDWAN rule displays the following:

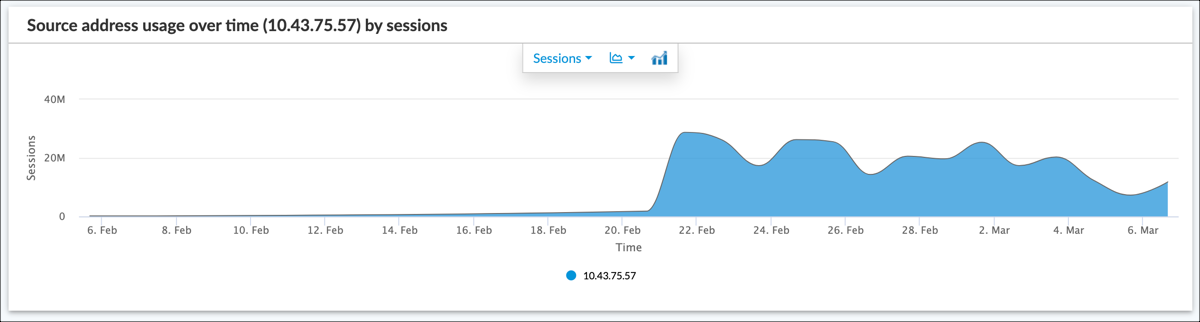
Source IP Address
To view statistics about NGFW source IP address usage, select Analytics > Dashboards > Security > Firewall > Source.
The Source dashboard displays the following table:
- Source IP Usage

To view statistics over time for a source IP address, select the address in the Source IP Usage table. For example, clicking 10.43.75.57 displays the following:
Destination IP Address
To view statistics about NGFW destination IP address usage, select Analytics > Dashboards > Security > Firewall > Destination.
The Destination dashboard displays the following table:
- Destination IP Usage

To view statistics over time for a destination IP address, select the address in the table. For example, clicking 8.8.8.8 displays the following:

Zones
To view NGFW zone usage for traffic that matches the rules configured in security access policies, select Analytics > Dashboards > Security > Firewall > Zones.
The Zones dashboard displays the following items:
- Zone Usage Over Time
- Zone Usage—Displays details for each zone, including:
- Number of sessions using that zone.
- Amount of received and transmitted traffic by volume (in bytes) and bandwidth that traffic matching for a zone is using.
- Total bandwidth that traffic matching for a zone is using.

To view statistics over time for a zone, in the Zone Usage table, select the zone. For example, clicking the Intf-LAN191-Zone zone displays the following:

Forwarding Class
To view forwarding class usage for traffic that matches the rules configured in security access policies, select Analytics > Dashboards > Security > Firewall > Forwarding Class.
The Forwarding Class dashboard displays the following items:
- Forwarding Class Usage Over Time
- Forwarding Class Usage—Displays details for each forwarding class, including:
- Number of sessions using that forwarding class.
- Amount of received and transmitted traffic by volume (in bytes) and bandwidth that traffic matching a rule is using.
- Total bandwidth that traffic matching a rule is using.

To view statistics for a forwarding class, in the Forwarding Class Usage table, select the class. For example, clicking the fc_be forwarding class displays the following:

Threats Dashboard
The Threats dashboard displays information about NGFW firewall statistics and analytics. To view the Threats dashboard, select Analytics > Dashboards > Security > Threats.
The Threats dashboard displays the following items:
- Statistics block
- Web
- IP
- File
- DNS
- CASB (Releases 22.1.3 and later)
- DLP (Releases 22.1.1 and later)
- Malware
- Vulnerabilities
- DDoS
- Summary
Threats Statistics Block
For Releases 22.1.1 and later.
To view a summary count of threat statistics for a time period, select Analytics > Dashboards > Security > Threats, and then select a time period from the third drop-down list in the horizontal menu bar.
The security threats statistics block displays a count for the following statistics:
- Threat types
- Critical severity
- High severity
- Medium severity
- Low severity

Web
To view statistics about threat filtering performed by NGFW and URL-filtering profiles, select Analytics > Dashboards > Security > Threats > Web.
The Web dashboard displays the following charts:
- Top URL Categories
- Top URL Reputations
- Top URL-Filtering Profiles
- Top URL-Filtering Sources

To view detailed statistics for a value in a chart, select the value. For example, clicking proxy_avoid_and_anonymizers in the Top URL Categories chart displays the following:

IP
To view threat statistics related to IP addresses, select Analytics > Dashboards > Security > Threats > IP.
The IP dashboard displays the following charts:
- Top IP-Filtering Actions
- Top IP-Filtering Profiles
- Top Filtering Destination Reputations
- Top IP-Filtering Sources

To view detailed statistics for a value in a chart, select the value. For example, clicking the reject action in the Top IP Filtering Actions chart displays the following:

File
To view threat statistics related to file filtering, select Analytics > Dashboards > Security > Threats > File.
The File dashboard displays the following charts:
- Top File-Filtering Actions
- Top File-Filtering Profiles
- Top File Types
- Top File-Filtering Sources

To view detailed statistics for a value in a chart, select the value. For example, clicking the IP address 172.30.57.191 in the Top File-Filtering Sources chart displays the following:

DNS
To view threat statistics related to DNS filtering, select Analytics > Dashboards > Security > Threats > DNS.
The DNS dashboard displays the following charts:
- Top DNS-Filtering Actions
- Top DNS-Filtering Message Types
- Top DNS-Filtering Actions
- Top DNS-Filtering Domains

To view detailed statistics for a value in a chart, select the value. For example, clicking response in the Top DNS Filtering Message Type chart displays the following:

CASB
Releases 22.1.3 and later.
To view threat analytics for cloud access security broker (CASB), select Analytics > Dashboards > Security > Threats > CASB.
The CASB dashboard displays the following charts:
- Top CASB Application
- Top CASB Action
- Top CASB Users
- Top Attackers

To view detailed statistics for a value in a chart, select the value. For example, clicking box_net in the Top CASB Applications Filtering Message Type chart displays the following:

RBI
For Releases 22.1.2 and later.
To view remote browser isolation (RBI) statistics, select Analytics > Dashboards > Security > Threats > RBI.
The RBI dashboard displays the following charts:
- Top RBI Browsers
- Top Users
- Top RBI URL Categories
- Top RBI URL Reputation

To view detailed statistics for a value in a chart, select the value. For example, clicking trustworthy in the Top RBI URL Reputation chart displays the following:

Malware
To view statistics about antivirus malare filtering, select Analytics > Dashboards > Security > Threats > Malware.
The Malware dashboard displays the following charts:
- Top Antivirus Malwares
- Top Infected Applications
- Top Victims
- Top Attackers

To view detailed statistics for a value in a chart, select the value. For example, clicking AV_DETECTION_TYPE_ DOWNLOADER in the Top Antivirus Malwares chart displays the following:

Vulnerabilities
To view statistics about security vulnerabilities, select Analytics > Dashboards > Security > Threats > Vulnerabilities.
The Vulnerabilities dashboard displays the following charts:
- Top Threats
- Top Signature IDs
- Top Sources
- Top Destinations

To view detailed statistics for a value in a chart, select the value. For example, clicking 10.135.1.83 in the Top Source chart displays the following:

ATP
For Releases 22.1.1 and later.
To view ATP file analysis statistics, select Analytics > Dashboards > Security > Threats > ATP.
Note: To view and download ATP file reports for individual files, see Manage ATP File Reports.
The ATP dashboards displays the following charts:
- Top ATP Analysis Type
- Top ATP Stages
- Top ATP Sources
- Top ATP Verdicts
- Top ATP File Types
- Top ATP Actions

To view detailed statistics for a value in a chart, select the value. For example, clicking AIML in the Top ATP Stages chart displays the following:
- Top ATP Verdicts (ATP-stage)
- Events (ATP-stage)
- ATP Logs (ATP-stage)

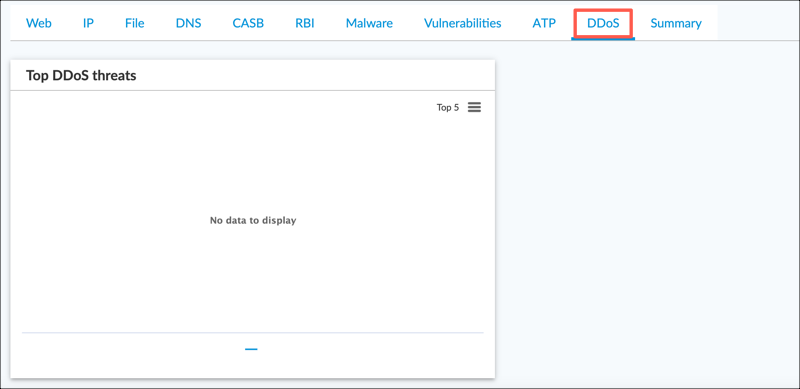
DDoS
To view DDoS threat statistics, select Analytics > Dashboards > Security > Threats > DDoS.
The DDoS dashboard displays the following chart:
- Top DDoS Threats chart
Summary
To view a summary of threats, select Analytics > Dashboards > Security > Threats > Summary.
The Summary dashboard displays the following charts:
For Releases 22.1.1 and later:
- Threat Activity over Time (chart)
- Top Threat Types (chart)
- Alerts by Severity (chart)
- Top Infected Applications (chart)
- Top Users with Threats (chart)
For Releases 21.2 and earlier:
- Top Appliances With Threats (chart)
- Top Threat Types (chart)

To view detailed statistics for a value in a chart, select the value. For example, clicking web-application-attack in the Top Threat Types chart displays the following:

DLP Dashboard
For Releases 22.1.3 and later.
The DLP dashboard displays information about DLP applications and users. To view the DLP dashboard, select Analytics > Dashboards > Security > DLP.
The DLP dashboard displays the following charts:
- Top DLP Applications
- Top DLP Action
- Top DLP User
- Top DLP Data Profiles

To view detailed statistics for a value in a chart, select the value. For example, clicking gmail in the Top DLP Applications chart displays the following:

Supported Software Information
Releases 21.2 and later support all content described in this article, except:
- Releases 22.1.1 and later support ATP and IoT dashboards. Support is added for a statistics block on the Threats dashboard.
- Releases 22.1.2 and later support the RBI dashboard.
- Release 22.1.3 adds support for the CASB and DLP dashboards.
Additional Information
Apply Log Export Functionality
View Analytics Dashboards and Log Screens