Monitor VOS Devices for Summary Information
![]() For supported software information, click here.
For supported software information, click here.
You can monitor Versa Operating SystemTM (VOSTM) devices for summary information about interfaces, application traffic, recent alarms, device health, and policy violations.
Monitor Device Summary Information (Releases 22.1.1 and later)
To monitor a VOS device for summary information:
- In Director view, select the Monitor tab.
- Select an organization, and then select the Devices tab.

- Click a device name to display summary information for the device.
The following example displays summary information for device Bangalore-ECT-DC-Active for organization Corp-Inline-Customer-1.

The screen displays the following information:
- Device Information—Displays the device name and its associated IP addresses. If the device is in a redundant pair, the other device in the pair is displayed.
- Interfaces table—Displays statistics for the device's interfaces.
- SD-WAN Application Traffic—Generates an SD-WAN application traffic chart based on selected parameters.
- Recent Events—Displays recent alarms for the device.
- Health Monitor—Displays the following information:
- Configuration sync status—Number of VOS devices whose configurations are in sync with the Director node’s configuration.
- Reachability status—Number of VOS devices reachable through ping or SSH from the Director node.
- Service status—Number of VOS devices whose services are running in a good state.
- Interfaces—Number of VOS device LAN and WAN interfaces whose status is up and down.
- BGP adjacencies—Number of BGP adjacencies in the established, connect, and idle state.
- IKE status—Number of IKE connections in the up and down state.
- Paths—Number of paths in the up and down state.
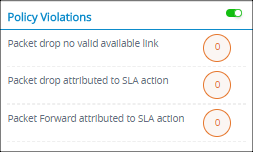
- Policy Violations— Total number of packets that have violated a device policy in the following categories:
- Packet drop no valid available link
- Packet drop attributed to SLA violation
- Packet forward attributed to SLA violation
Monitor Device Summary Information (Releases 21.2 and earlier)
For Releases 21.2 and earlier.
To monitor summary information for a VOS device:
- In Director view:
- Select the Configuration tab in the top menu bar.
- Select Devices > Devices in the horizontal menu bar.
- Select a device in the main pane. The view changes to Appliance view.
- Select the Monitor tab in the top menu bar.
- Select the provider organization in the left menu bar.

The Summary dashboard displays the following information:
- Device information—Device name, location, and access status.
- CPE Interfaces—Traffic across interfaces.
- SD-WAN Application Traffic—Real-time traffic monitoring of ingress and egress traffic over multiple ports.
- Recent Events—Alarms generated on the device.
- Health Monitor—Summary of the network connectivity and device status of the associated Director node.
- Policy Violations—Traffic violations that have occurred for a device in the organization.
- Application Activity—Top 10 most-utilized applications on the device. You can display the remaining applications in the detailed view.
CPE Interfaces
The CPE Interfaces pane displays a live graph that shows the live traffic bandwidth on multiple ports, either for all traffic or only SD-WAN traffic. Data traffic is fetched from the device every two seconds.
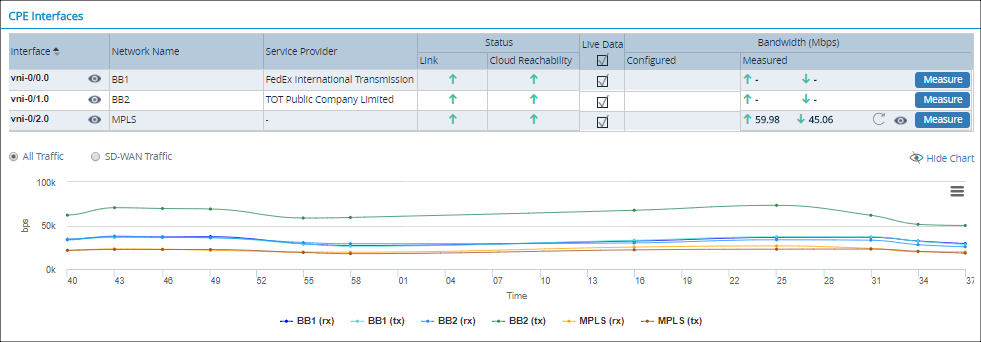
The dashboard displays:
- Interface name
- Network name
- Service provider
- Status of the link and cloud reachability.
- Live data indicator—When enabled, live traffic is show
- Bandwidth—Configured and measured, in Mbps
To measure bandwidth:
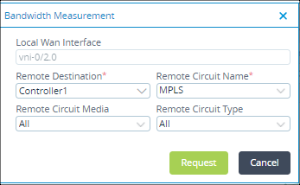
- Click Measure (on the CPE Interfaces screen) to view the uplink and downlink bandwidth.
- Select the remote destination.
- Select the remote circuit.
- Click Request.
To display bandwidth details, click the ![]() Eye icon that is before the Measure icon on the CPE Interfaces screen:
Eye icon that is before the Measure icon on the CPE Interfaces screen:

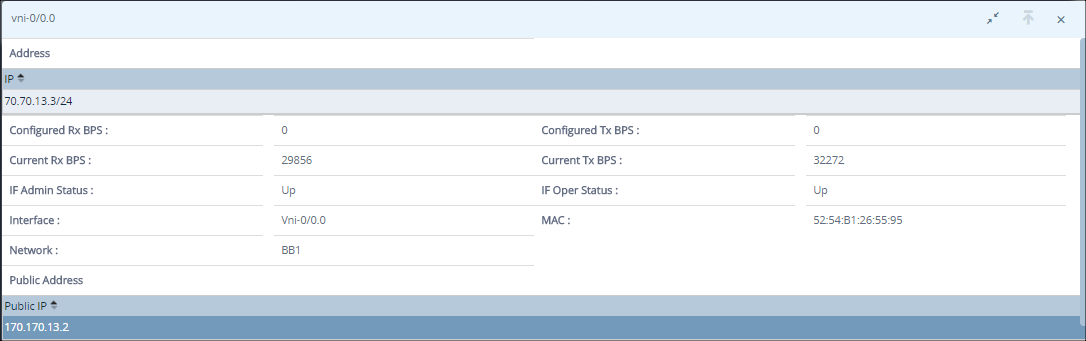
To display interface details, click the ![]() Eye icon that is next to the interface name on the CPE Interfaces screen:
Eye icon that is next to the interface name on the CPE Interfaces screen:
SD-WAN Application Traffic
Monitoring live application and rule traffic allows you to display any priority application traffic terminating on any access circuits at a site. It also allows you to select the remote branch or remote circuits for the rule or application. This pane displays the SD-WAN application traffic (uplink and downlink) for the selected remote branch, circuits, and rule.
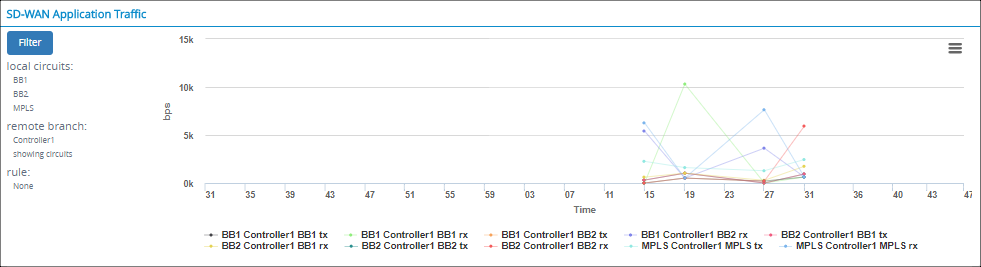
To filter the SD-WAN application traffic:
- Click the Filter icon. The SD-WAN Application Traffic panel displays.
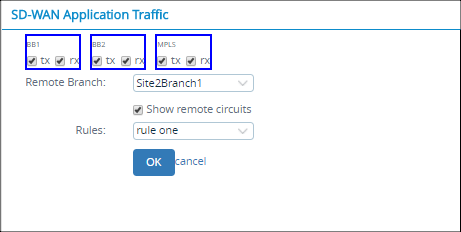
- Click the tx and rx checkboxes of the required circuits to view the incoming and outgoing traffic.
- Select a remote branch from the Remote Branch list.
- Click Show Remote Circuits to view the remote circuits.
- Select a rule from the Rules list. Rules determine the type of traffic allowed between branches for a given application, such as FTP and HTTP. There can be different rules for different applications.
- Click OK.
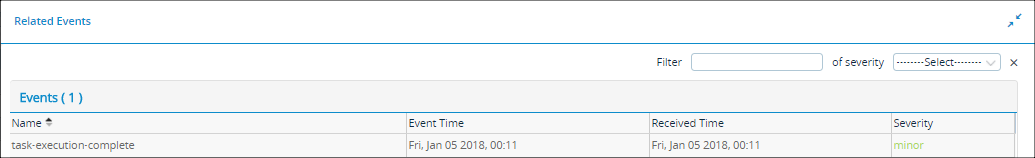
Recent Events
The Recent Events pane summarizes all alarms for a customer organization and its devices, displaying alarms by severity levels—critical, major, minor, indeterminate, and warning.

Click the Detail icon to view event details.

Click the Back icon to go back to the tile view.
Click a device name to display device-specific events.
Click the Eye icon in the Handling State column on the Events screen to assign tasks. Alternatively, select the check box corresponding to a device record and click the ![]() Handle/Assign icon on the top right menu bar to assign tasks.
Handle/Assign icon on the top right menu bar to assign tasks.
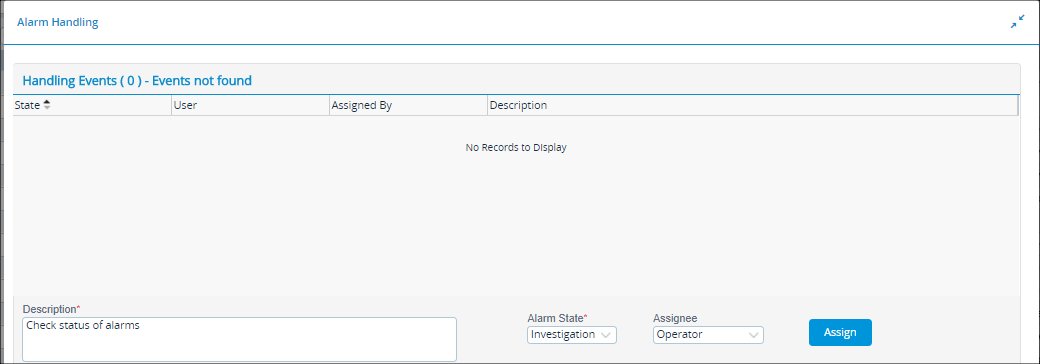
To assign a task:
- Enter the event description.
- Select the alarm state:
- Acknowledge
- Close
- Investigation
- None
- Observation
- Select the Assignee (Operator or Administrator).
- Click Submit.
Health Monitor
The Health Monitor pane displays a summary of a device associated in the customer organization.
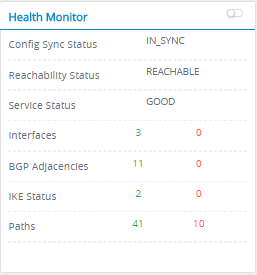
This screen automatically refreshes every 30 seconds. To disable auto-refresh, click Autorefresh.
This pane displays the following parameters:
- Configuration sync status—Number of VOS devices whose configurations are in sync with the Director node’s configuration.
- Reachability status—Number of VOS devices reachable through ping or SSH from the Director node.
- Service status—Number of VOS devices whose services are running in a good state.
- Interfaces—Number of VOS device LAN and WAN interfaces whose status is up and down.
- BGP adjacencies—Number of BGP adjacencies in the established, connect, and idle state.
- IKE status—Number of IKE connections in the up and down state.
- Paths—Number of paths in the up and down state.
Click Interfaces to display the health status of each interface.

Policy Violations
The Policy Violations pane displays the total number of packets that have violated a device policy.
Application Activity
The Application Activity pane provides a visual representation of the top 10 utilized applications on the device, selected based on the following parameters:
- Sessions
- Transactions
- Total Bytes Forward
- Total Bytes Reverse
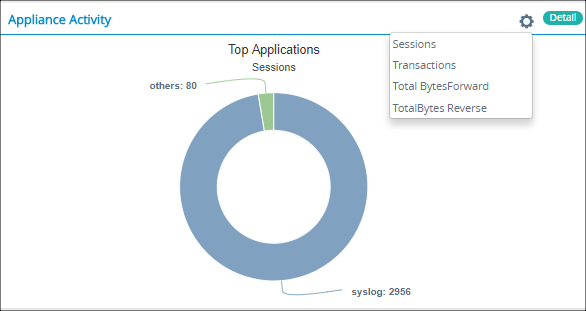
Click the Settings icon and select a parameter. The graph refreshes to display real-time statistics for the applications.
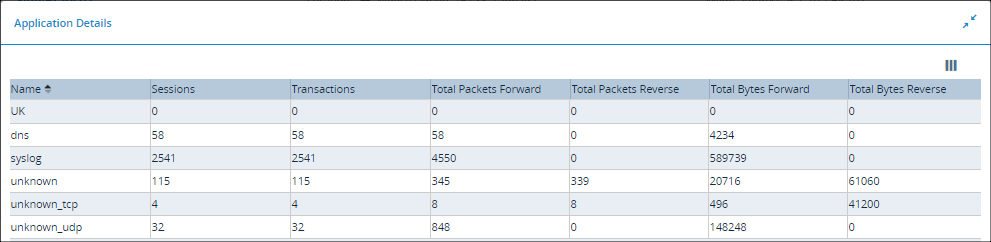
Click the Details icon to view more information (number of sessions, transactions, packets forwarded, packets reversed, etc.) of each application.
Supported Software Information
Release 20.2 and later support all content described in this article, except:
- Releases 22.1.1 presents alternate information on the device summary tab.