Monitor Director Nodes Using Open Source Tools
![]() For supported software information, click here.
For supported software information, click here.
Versa Director nodes consist of several software components, which use CPU, memory, disk, and input/output resources. To ensure high availability and optimal performance of Director nodes, you should periodically monitor the health of the software components and resources.
You can monitor Director nodes using the Prometheus monitoring system, and you can query the data collected by Prometheus and visualize it using the Grafana observability platform. Prometheus is an open-source systems monitoring and alerting toolkit that collects and aggregates metrics from various endpoints and stores them in a time-series database. The Grafana application allows you to query, visualize, and alert on metrics and logs.
To monitor Director nodes, you need the following:
- Node Exporter—Monitoring agent. You install and enable this monitoring agent on each Director node that you want to monitor.
- Prometheus server—Monitoring server. You install and enable this monitoring server on an Ubuntu server that has reachability to the monitoring agents.
- Grafana—Open source monitoring application that you use to view system metrics.
Configure the Monitoring Agent
Node Exporter is the monitoring agent, and it provides visibility to a wide variety of hardware and kernel-related metrics. Node Exporter is packaged with the Director image, and it listens on the default port, which is 9100.
To verify metrics that are exported, curl the /metrics endpoint by issuing the curl http://director-node-IP-address:9100/metrics CLI command. The following image shows a sample output of the curl command:

Install and Configure the Monitoring Server
Prometheus is the monitoring server. You download Prometheus onto a dedicated Ubuntu virtual machine (VM), and then you install and run it from this VM. The monitoring server runs in a Docker container. The Ubuntu VM must have reachability to the monitoring agents.
To install and configure the Prometheus monitoring server package:
- If necessary, install the Docker container on the Ubuntu server:
sudo apt-get update
sudo apt-get install docker.io
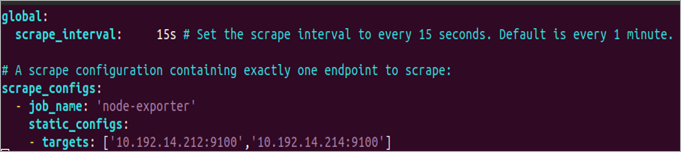
- Configure the monitoring agent reference for Prometheus so that it can collect metrics from Node Exporter. To do this, create the prometheus.yml configuration file, and then add the following contents to the file. The following table describes the file contents.
global:
  scrape_interval: intervals  # Set the scrape interval
  scrape_configs:
      - job_name: 'job-name'
        static_configs:
        - targets: ['monitoring-agent1-ip-address:9100',..., 'monitoring-agentN-ip-address:9100']
Field Description global
Section that specifies default parameters that are valid in all configuration contexts.
scrape_interval
How often Prometheus collects metrics from the targets. You can set the scrape separately for each job.
job_name
Default job name assigned to the collected metrics.
scrape_configs
Set of targets from which to collect metrics.
targets
List of IP addresses and ports that the agents use to allow access to metrics.
For example:
- Issue the following CLI command to run the Prometheus docker container in the background. In the command, replace path-to-prometheus.yml-file with the absolute path where the Prometheus configuration file is located. Note that you type this command on a single line.
sudo docker run -d --name prometheus -p 9090:9090
-v path-to-prometheus.yml-file:/etc/prometheus/prometheus.yml prom/prometheus
--config.file=/etc/prometheus/prometheus.yml
- Check whether Prometheus has been deployed in the container:
sudo docker container ls
For example:
sudo docker container ls
CONTAINER ID    IMAGE             COMMAND                    CREATED            STATUS            PORTS                                        NAMES
a743aeld67B6    proM/proMetheus   "/bin/proMetheus ··C..."   31 seconds ago     Up 30 seconds
- To view node metrics from the Prometheus dashboard, access the Prometheus GUI on port 9090, http://monitoring-server-ip-address:9090/graph. The Prometheus dashboard displays.

- To display metrics, enter a query, and then click Execute.
Monitor Versa Director
To monitor a Director node using Grafana and Prometheus:
- Issue the following CLI command to run the Grafana docker container in the background:
sudo docker run -d --name grafana -p 3000:3000 grafana/grafana
- Access the Grafana GUI on port 3000, at the URL http://monitoring-server-ip-address:3000/graph.
- To integrate Prometheus with Grafana, log in to the Grafana application, and then create a Prometheus data source:
- Select Configuration in the left menu bar.
- Click Data Sources, and then click Add Your First Data Source.

- Click Data Sources, and then click Add Your First Data Source. The Add Data Source window displays.
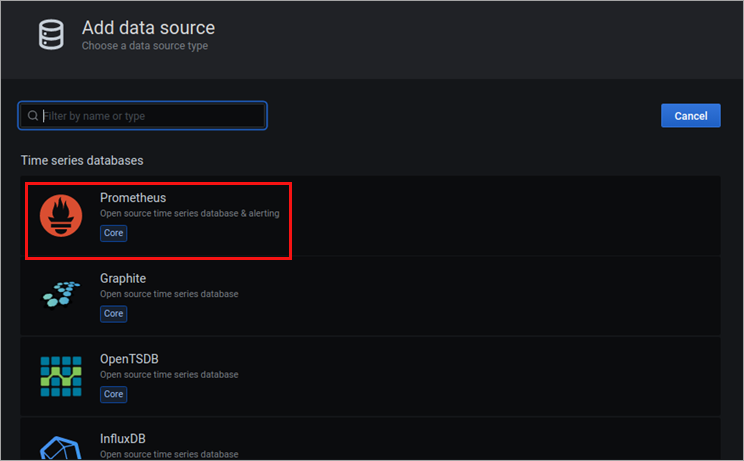
- Select Prometheus. The following window displays.

- In the HTTP group of fields, enter the URL of the Prometheus server in the URL field.
- Set other data source settings, as required.
- Click Save and Test to save the data source.
- To view Director node metrics from Grafana:
- Select Create in the left menu bar.
- Click Import. The following window displays.
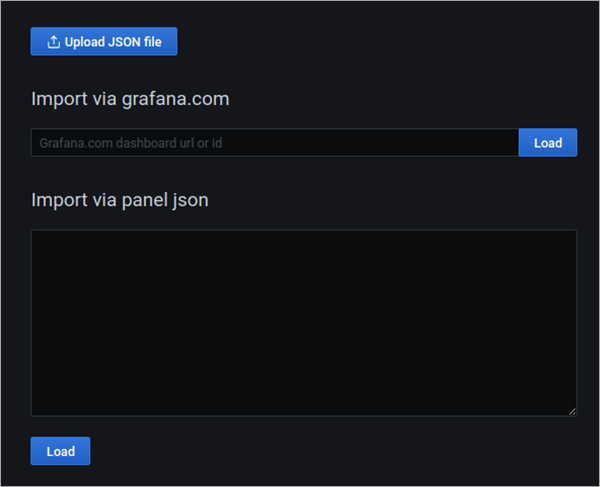
- Click Upload JSON file, and the upload the NodeMetrics.json file from the /opt/versa/vnms/scripts/NodeMetrics directory on the Director node.
- Click Load to create the Versa Director Node Metrics, as shown in the following screenshot.

- Save the dashboard from dashboard settings.
Supported Software Information
Releases 21.1.4 and later support all content described in this article.
Additional Information
Monitor Analytics Clusters Using Open Source Tools
Use the Versa Director Monitor Dashboard