View Concerto Secure Access Dashboards
![]() For supported software information, click here.
For supported software information, click here.
Versa Secure Private Access (VSPA) connects users to private applications securely, regardless of location or hosting environment. User devices and Versa Operating SystemTM (VOSTM) devices forward VSPA statistics to Versa Analytics.
You can view charts, tables and maps about VSPA activities from Secure Access dashboards in Concerto. For each tenant, you can view information about the following:
- VSPA Overview—Successful and failed login attempts, active users, and dashboards for statistics.
- Users—VSPA client user statistics based on usage, events, and registry.
- Digital Experience Monitoring—(For Releases 12.1.1 and later.) Information about the end-to-end network and application experience for each user device.
- Site-to-Site Tunnels—Tunnels that are up or down, tunnel status, top tunnels by bandwidth.
- Routes—Route details such as destination, state, protocol, and real-time performance monitoring (RPM).
Secure Access Dashboard Parameters
For many Secure Access dashboards, you can select parameters to do the following:
- Define the dashboard data source.
- Limit output to a single device.
- Define the time frame for dashboard maps, charts, and statistics.
To select dashboard parameters, go to View > Dashboard > Secure Access, and then select values from the following drop-down lists:
- In the first drop-down list, select a DCA complex to use its Analytics cluster as the data source.
For Releases 11.4.1 and later, you can select an aggregator cluster in this menu to view combined data from multiple DCA complexes. - In the second drop-down list, select an individual VOS device (appliance) to display data for the device. By default, data for all appliances displays.
- In the third drop-down list, select the time frame for the display.

View Secure Access Overview Information
To view secure access overview information, select View > Dashboard > Secure Access > Overview.
The screen displays the following:
- A statistics block with secure access information
- Failed and successful attempts
- Number of active users
- Geographic map with users and login attempts. For information about viewing the map, see Secure Access Map, below.
- Secure access charts
- Statistics by Concurrent Users
- Statistics by Successful Attempts
- Statistics by Failed Attempts
- Top Appliances by User Count
- Top Continents by User Count
- Top Cities by User Count
- Top Countries by User Count

Secure Access Map
To view a geographic map of secure access users, select View > Dashboard > Secure Access > Overview. Then, click the drop-down list in the upper right corner of the map (shown below) and select Users View.

Click a ![]() User icon to view the following information about the user:
User icon to view the following information about the user:
- User—Email address
- Appliance—Appliance name
- IP—User's WAN IP address
To view network information for active users, select Network View from the drop-down list in the upper right corner of the screen.
View Secure Access Users Information
To view statistics about a tenant's VSPA users, select View > Dashboard > Secure Access > Users.
The dashboard displays the following tabs:
- Summary
- Usage
- Events
- Registry
Users Summary
To view summary information about VSPA users, select View > Dashboard > Secure Access > Users > Summary.
The screen displays the following charts and table:
- Top Appliances by User Count
- Top Continents by User Count
- Top Countries by User Count
- Top Cities by User Count
- User Count

Usage
To view usage information for VSPA users, select View > Dashboard > Secure Access > Users > Usage.
The screen displays the following charts and table:
- Statistics per User
- Top users by Bandwidth
- Statistics per User

In the Statistics per User table, click on a user name to view user statistics by bandwidth, applications, business tags, and categories. The screen displays the following charts and table:
- Statistics for username
- Top Applications of username
- Business Tags of username
- Categories of username
- Statistics for username

Events
To view event information for VSPA users, select View > Dashboard > Secure Access > Users > Events.
The Events tab displays the following charts and table:
- Events per User
- Events per Type
- Events

The Events table displays the following fields:
|
Field |
Description |
|---|---|
| Receive Time | Displays the time when the event occurred on the device. |
| Appliance | Displays the name of the device on which the event occurred. |
| User | Displays the username. |
| User IP | Displays the user's IP address. |
| Event | Displays the event type. |
| Description |
Displays the event description, including the reason for authentication failure. Common reasons for authentication failures are:
|
Registry
To view registry information for VSPA users, select View > Dashboard > Secure Access > Users > Registry.
The Registry tab displays the following charts and table:
- Top Client OS
- Top Secure Access Client Version
- Appliances with Secure Access Users
- Registrations

The Registrations table displays the following fields:
| Field | Description |
|---|---|
| Date, Time | Displays the date and time of the registration. |
| Appliance | Displays the remote access gateway device name. |
| Users | Displays the username. |
| OS | Displays the OS running on the device on which the VSPA client is installed. |
| OS Version | Displays the OS version. |
| Client Version | Displays the VSPA client version. |
| Latitude, Longitude | Displays the latitude and longitude of the VSPA client. |
Live Users
To view information about VSPA users who are currently active, select View > Dashboard > Secure Access > Users > Live Users, and then select a device from the first drop-down list.

Click the IPsec Users or SSL Users tab to display information about users connecting using IPsec or SSL protocol.
View Digital Experience Monitoring Information
You can enable Digital Experience Monitoring (DEM) on secure access client devices to periodically monitor end-to-end network and application performance for the devices. When DEM is enabled on a device, secure access clients collect the following metrics for a user device:
- Device memory, CPU, disk utilization, and battery life
- WiFi signal strength, and transmit and receive bandwidth per SSID
- Local network segment metrics such as delay, jitter, and packet loss
- Internet segment metrics such as delay, jitter, and loss, both end-to-end and for each hop level
- Application metrics, including DNS lookup time, TCP and SSL connect times, HTTP latency, time to first and last byte, delay, jitter, and packet loss to application server.
The client device sends these metrics to Versa Analytics, which uses them to derive an experience rank value that ranges from 1 through 100. A value of 1 represents the best experience for the user’s device and applications, and a value of 100 represents the worst experience. Versa Analytics also provides in-depth information about the experience at the tenant, gateway, device, and application levels.
To view the DEM information, select View > Dashboard > Secure Access > Digital Experience.
The Secure Access Digital Experience dashboard displays the following tabs:
- Overview
- Users
- Applications
DEM Overview
To view DEM overview information, select View > Dashboard > Secure Access > Digital Experience > Overview.
The screen displays a geographic map of DEM activities. The first subtab, Active User Devices, displays a map for all users. The remaining subtabs display versions of the map that only include users with potentially suboptimal experiences. Users are grouped by the following types of issues:
- Local Issues
- WiFI Issues
- Internet Issues
- Application Issues

To zoom in on a country you can:
- Click the circle icon displayed for the country on the map.
- Click the country name in the table to the right of the map.

To zoom in on a city, click the city name in the table to the right of the map. The users located in the city display in the table to the right of the map.

To view detailed information for a specific user, select the username in the table. The screen displays User Information and User Applications tabs for the user. For more information, see Individual User Information and Individual User Application Information, below.
DEM Users
To view statistics for DEM users, select View > Dashboards > Secure Access > Digital Experience > Users. The User Experience Metrics table displays.

Individual User Information
To view detailed DEM information for a user, select the Zoom icon to the left of a row in the User Experience Metrics table.
The following screen displays, with the User's Information tab selected by default. The User's Information tab displays the following charts:
- User's Most Recent Information
- Experience Across Network—Last reported performance at different points in the network.
- User Experience Over Time
- WiFi Experience Over Time—Signal strength per WiFi SSID over time. A signal quality value of 0 through 33 is considered poor, 34 through 66 is degraded, and 67 through 100 is good.
- Local Network Latency Over Time—Local network latency and jitter metrics over time. Use this information to help determine whether there are issues connecting to the next-hop gateway.
- Local Network Loss Over Time
- Internet Delay Over Time—Internet delay and jitter metrics over time. Use this information to help determine whether there are network issues in the internet segment connecting to the SASE gateway.
- Internet Loss Over Time
- CPU Utilization
- Memory Utilization
- Battery Status
- Disk Utilization

Individual User Application Information
To view a detailed view of user application information for a user, select View > Dashboards > Secure Access > Digital Experience > Users. Then, in the User Experience Metrics table, select the Zoom icon to the left of a row, and then select the User's Applications tab. The Application Experience Metrics table displays.

Select the ![]() Zoom icon to the left of a row to display application details for the user, device, and application listed in the row.
Zoom icon to the left of a row to display application details for the user, device, and application listed in the row.
The screen displays the following charts:
- Application Experience Across Network Segment
- Application Rank—User device’s application performance over time for a specific application.
- Application Network Statistics—User device’s application network performance metrics for delay, jitter and loss, over time for a specific application.
- Application Traceroute—Last known traceroute results for an application server through various network hops.
- DNS Lookup Time—Time taken to perform DNS operations over time for a specific application.
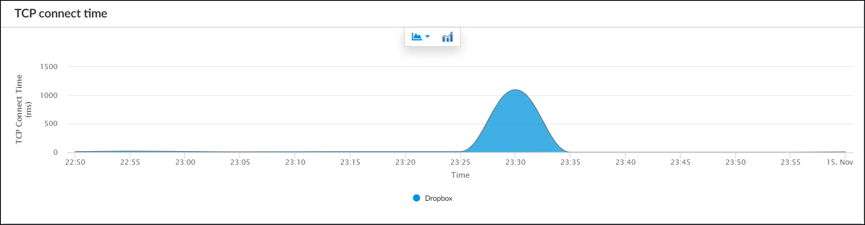
- TCP Connect Time—Time taken to establish TCP connectivity over time for a specific application.
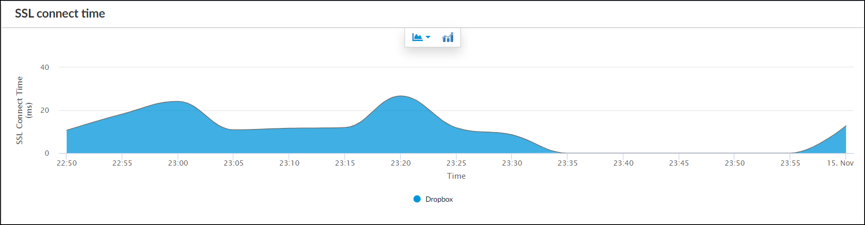
- SSL Connect Time—Time taken to perform SSL handshake over time for a specific application.
- HTTP Latency—Time taken to perform HTTP operations over time for a specific application.
- Data Transfer Time—Time taken to transfer data from the client to the server over time for a specific application.
- Time to First and Last Byte—Time time taken to transfer first and last byte over time for a specific application.
DEM Applications
To view a list of applications and overall application performance for a tenant, select View > Dashboard > Secure Access > Digital Experience, and then select the Applications tab. The Application User Experience Metrics table displays.

In the Application User Experience Metrics table, click an application to view a map of application server locations and the application performance for the users connected to the servers.
The following example shows the locations of the application servers for users of the CrowdStrike Falcon application.
.png?revision=1)
To view the users connected to an application server, click the application server location on the map. The following example displays the users connected to an application server. The colors of the users connected to an application server represent the following user experience levels:
- Green—Good
- Yellow—Degraded
- Red—Poor
The Application Experience Metrics table displays the application rank and related metrics for the selected application for each user device.

To display application performance details for the user, device, and application listed in the row, select the Zoom icon to the left of a row.
The screen displays the following charts:
- Application Experience Across Network Segment—Last reported performance at different points in the network.
- Traceroute to Application Server—Last known traceroute results for an application server through various network hops.
- Application Rank—User device’s application performance over time for a specific application.
- Application Network Statistics—User device’s application network performance metrics for delay, jitter and loss, over time for a specific application.
- DNS Lookup Time—Time taken to perform DNS operations over time for a specific application.
- TCP Connect Time—Time taken to establish TCP connectivity over time for a specific application.
- SSL Connect Time—Time taken to perform SSL handshake over time for a specific application.
- HTTP Latency—Time taken to perform HTTP operations over time for a specific application.
- Data Transfer Time—Time taken to transfer data from the client to the server over time for a specific application.
- Time to First and Last Byte—Time time taken to transfer first and last byte over time for a specific application.

![]()
.png?revision=1)


View Site-to-Site Tunnel Information
To view statistics about a tenant's site-to-site tunnels, including tunnel status and top tunnels by bandwidth, select View > Dashboards > Secure Access > Site-to-Site Tunnels.
The screen displays the following information:
- Tunnels Statistics Block—Total Tunnels, Up Tunnels, Affected Tunnels (IPsec and EBGP)
- Site-to-Site Tunnels map
- Site-to-Site Tunnels table

In the Site-to-Site Tunnels table, click the arrow in the first column to view details for a row.

View Secure Access Routes Information
You can view statistics about the SASE gateway routes that are used by the tenant for secure access connection.
To view SASE gateway routes information for a tenant, select View > Dashboard > Secure Access > Routes.

The Routes table displays the following fields:
| Field | Description |
|---|---|
| Destination | The destination IP address of the SASE gateway route. |
| Active | Displays if the gateway is active (true or false). |
| Protocol | Protocol used by the route. |
| If Name | Interface used by the route. |
| Gateway Address | The SASE gateway IP address of the route. |
| Duration | Duration for which the route has been active. |
| TOS | Type of service (TOS) bits in the IPv4 header. |
| RPM | Real-time performance monitoring details for the route. |
To display routing details for a row in the Routes table, select the arrow in the first column of that row, as shown below.

Supported Software Information
Releases 11.3.1 and later support all content described in this article, except:
- Release 11.4.1 adds support for selecting an aggregator node to view analytics that is aggregated from multiple Analytics clusters.