View Concerto SD-WAN Dashboards
![]() For supported software information, click here.
For supported software information, click here.
SD-WAN dashboards provide a combination of monitoring and analytics in Concerto, with real-time and historical data at a single location. To view the SD-WAN dashboards, navigate to View > Dashboard > Secure SD-WAN. The information that you can view depends on your role and the tenant license.
You can view the following information about devices in your network:
- Real-time SD-WAN information for all devices.
- Historical SD-WAN information for all devices.
- Status, configuration, and troubleshooting information for individual devices.
Perform Real-Time Monitoring for All Devices
To view real-time information about devices in your network, select View > Dashboard > Secure SD-WAN > Overview, and then select the Real Time tab. The screen displays the following:
- Device Summary statistics block—Total number of VOS devices (appliances), number of devices in Up or Down state, LAN links,WAN links, and device alarms.
- Device Locations list—List of device locations. You can choose either map or table view.
- Tenant Health table—Health statistics for devices.
- Asset Summary table—Count of devices, by category: appliance, hub, hub controller, or SSE gateway.

Device Summary Statistics
To view device summary statistics, such as device status, WAN links, and device alarms, select View > Dashboard > Secure SD-WAN > Overview > Real Time.
Device summary statistics appear at the top of the screen. These include:
- Total Appliances—Count of devices.
- Up/Down—Count of devices in the Up or Down state.
- LAN Links—Count of down LAN links. Click the down count to view down LAN link details.
- WAN Links—Count of down WAN links. Click the down count to view down WAN link details.
- Alarming Devices—(Releases 11.3.2 and later.) Count of critical and major device alarms.

View and Clear Alarms
For Releases 11.3.2 and later.
You can view and clear (delete) device alarms from the Alarming Devices section of the statistics block.
To clear alarms of Critical or Major severity for all devices, select the Edit icon in the Alarming Devices section. Then, in the Clear All Alarms by Severity popup window, select Critical or Major, and then click Clear.

To view details about all alarms, click the Critical or Major alarm count, as shown below.

The Alarming Devices popup window displays. Click the Appliances with Alarms tab to view alarm information for all devices.

Click the Alarm Details tab to view details for all alarms.

For Releases 12.2.1 and later.
You can clear alarms for specific devices. To do this, go to the Appliances with Alarms tab, and then click the box to the left of one or more appliance names, as shown below.

Click Clear Alarms. The Clear Alarms on Selected Appliances popup window displays.

Select the severity of the alarms that you want to clear, and then select Clear.
Device Locations
To view device locations, select View > Dashboard > Secure SD-WAN > Overview > Real Time. A list of device locations appears on the screen, below the device summary statistics.
You can choose to view locations in either a map or table format.
- To view device locations in map format, select the Map icon, as shown below.

- To view device locations in table format, select the List icon, as shown below.

Tenant Health
To view a summary of the health of the current organization's (tenant) devices, select View > Dashboard > Secure SD-WAN > Overview > Real Time. The Tenant Health table appears on the screen below the device locations.
Each row in the table contains a device health category and lists the number of category-related items that are up, down, or disabled.
The device health categories are:
- Configuration Sync Status—Indicates whether the configuration on a device is in sync with the configuration in the Concerto node's database.
- Reachability Status—Indicates whether a device is reachable from the Concerto node.
- Service Status—Status of the services running on devices.
- BGP Adjacencies—Number of BGP peering sessions.
- Interfaces—Number of interfaces.
- IKE—Number of IKE connections.
- Paths—Number of SD-WAN paths.

For each device health category, you can click on the category to view a breakdown of Up, Down, and Disabled status for individual devices.
For Releases 12.2.1 and later, you can download the Tenant Health table to a CSV file on your local system. To do this, click Download CSV in the upper-right corner of the table.
Device Status
To view a summary of device status, categorized by VOS device type, select View > Dashboard > Secure SD-WAN > Overview > Real Time. The Asset Summary table appears on the screen below the Tenant Health table.
You can view a status summary for the following categories:
- Appliances
- Hubs
- Hub controllers
- SSE gateways

For each device type, you can click on the category to view details for individual devices.
View Historical Information for All Devices
Historical SD-WAN data is exported by VOS devices and stored in Analytics cluster datastores for a period of time, typically between 3 and 90 days. In topologies with multiple DCA complexes, the data may be distributed across multiple Analytics clusters. In this case, the data can be recombined using an Analytics aggregator cluster. You can choose to view data from an individual DCA complex or combined data from an aggregator cluster.
To view historical information about devices in your network, select View > Dashboard > Secure SD-WAN > Historical, and then in the first drop-down menu select a DCA complex or aggregator cluster.
The screen displays the following items:
- Statistics block—Statistics for sites. See SD-WAN Statistics Block, below.
- Top Sites chart—Displays top sites by various metrics, such as bandwidth. To change the metric, select a new metric from the drop-down list in the chart.
- Top Access Circuits chart—Displays top access circuits by various metrics, such as bandwidth. To change the metric, select a new metric from the drop-down list in the chart.
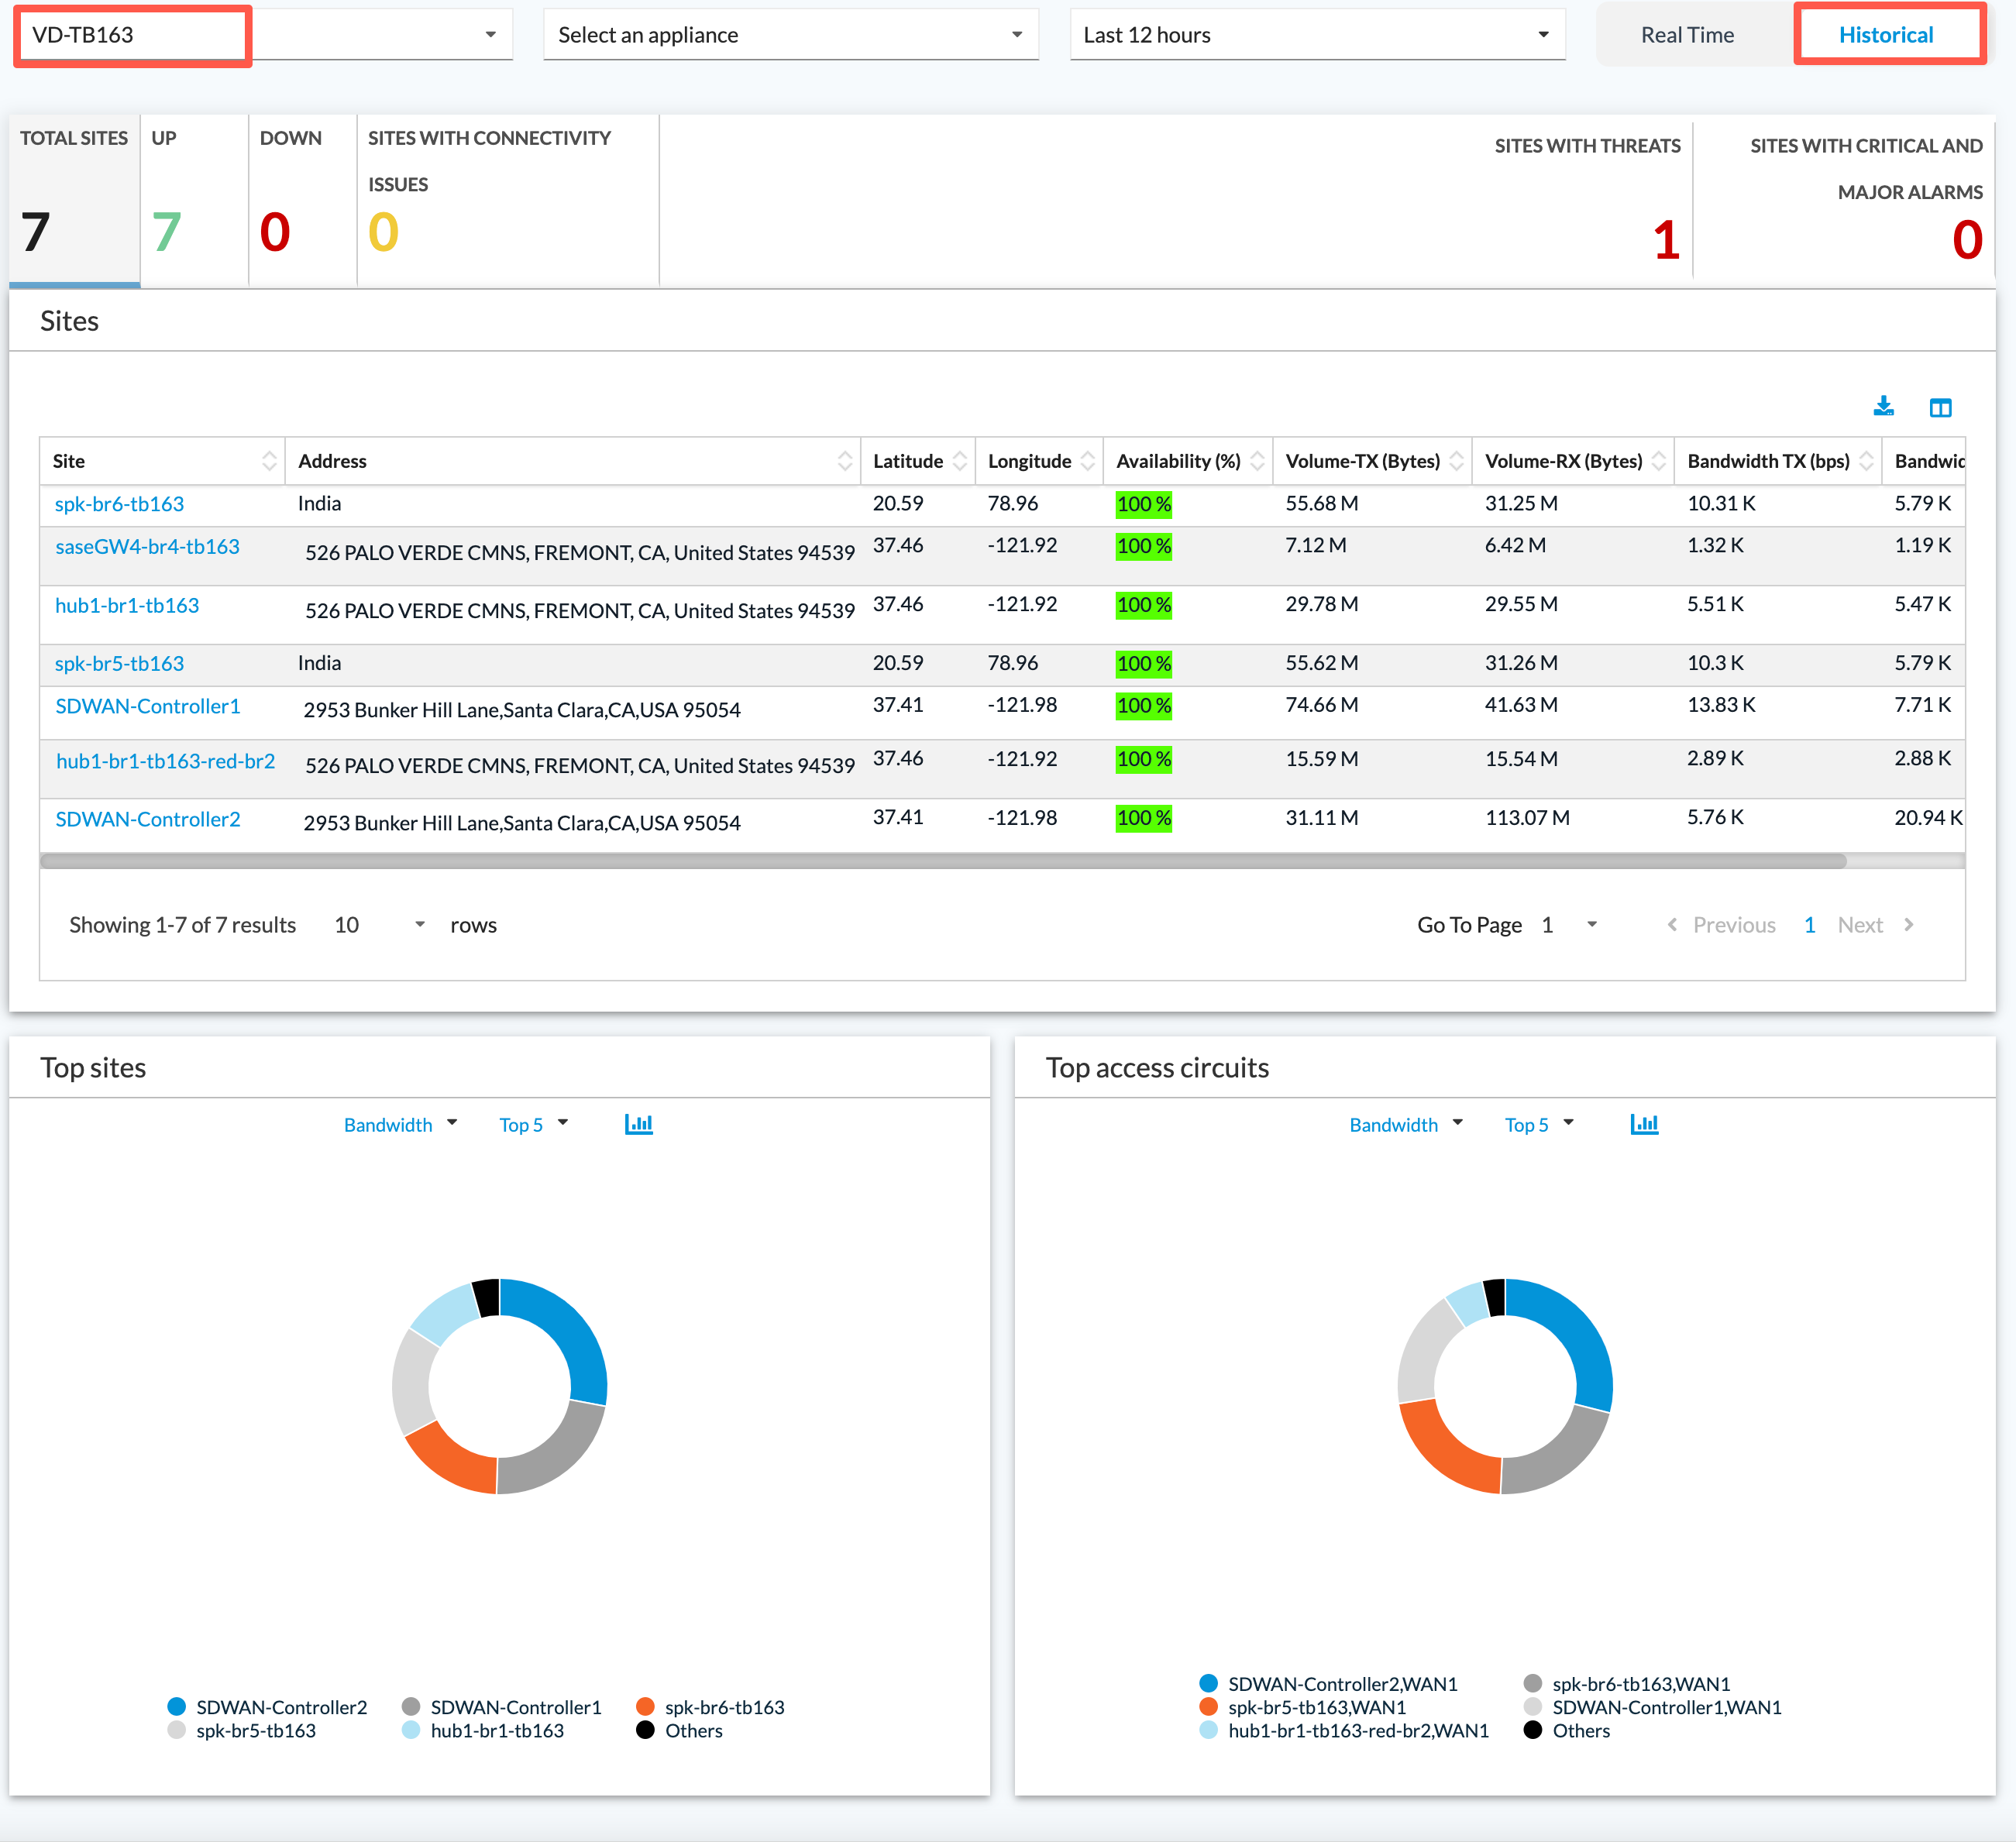
SD-WAN Statistics Block
To view a table or chart related to a statistic in the statistics block, click one of the following tiles:
- Total Sites—Displays availability and traffic information for devices. You can click a device name in the Sites column to display link usage information for the device.

- Up—Displays availability and traffic information for devices that are up during the selected time period. You can click a device name in the Sites column to display link usage information for the device.

- Down—Displays availability and traffic information for devices that are down during the selected time period.

- Sites with Connectivity Issues

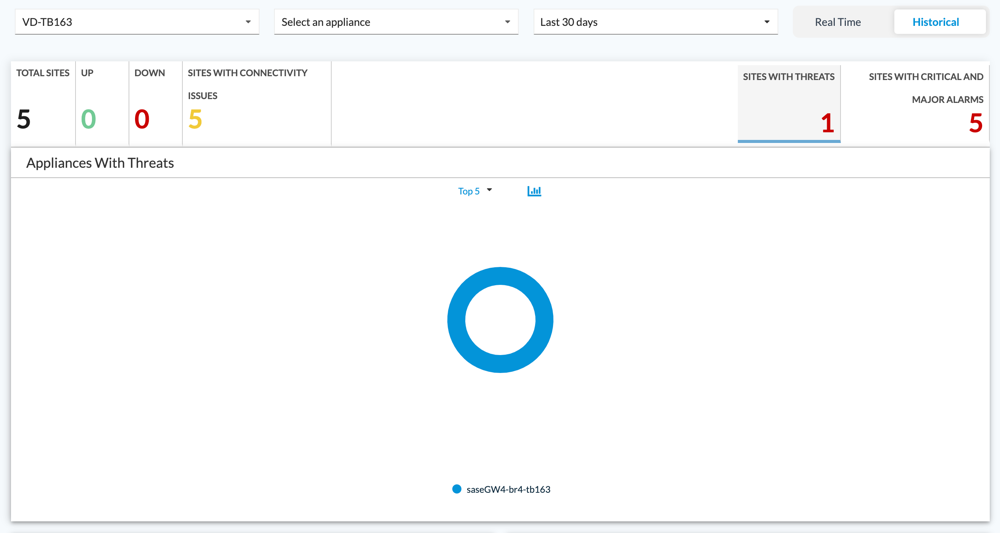
- Sites with Threats
- Sites with Critical and Major Alarms

Monitor Individual VOS Devices
To monitor an individual VOS device, select View > Dashboard > Secure SD-WAN > Overview, and then select the device from the Select an Appliance drop-down list.
The screen displays the following information for the device:
- Map of geographic location
- City
- Site ID
- Reachability status
- Profile
- Hardware and software details
You can select from the following tabs to view detailed information about the device:
- Availability
- Interfaces
- Applications
- Users
- Tunnels
- Quality of Service (QoS)
- Virtual Routers (VRFs)
- Health
- Alarms
- Routing
- Troubleshoot
To change the time interval of the information, select a value in the Last 12 Hours drop-down list. You can select the last 5 or 10 minutes, 1 or 12 hours, single day, or 7 or 30 days. You can also select a custom time range.

Device Availability
For Releases 11.4.1 and later.
To monitor the availability of an individual device, select View > Dashboard > Secure SD-WAN > Overview, then select the device from the Select an Appliance drop-down list. Select the Availability tab to view the following charts and tables:
- Total Availability
- Availability over Time
- Service Uptime
- Data Plane Connectivity over Time
- Connectivity Statistics
- Link Availability
- Site Status Log

In the Connectivity Statistics table, click a device name to view the following charts for the device:
- Datapath Downtime
- Remote Sites Up/Down
- Paths Up/Down

Device Interfaces
To monitor the interfaces for an individual device, select View > Dashboard > Secure SD-WAN > Overview, then select the device from the Select an Appliance drop-down list. Select the Interfaces tab to view the following:
- Physical and Logical Interfaces—Configuration information for interfaces on the device
- Usage—Real-time and historical usage information for interfaces on the device
Physical and Logical Interface Configurations
To view the interfaces for the current device, select the Interfaces > Physical and Logical Interfaces tab. Click an interface to view configuration information for the interface.

Real-Time Interface Usage
To perform real-time monitoring of interfaces for the current device, select the Interfaces > Usage tab, and then select the Live tab.
The screen displays the following chart and table:
- Interfaces table—Displays real-time interface performance statistics.
- Overall Interface Usage by Bandwidth chart—Displays bandwidth performance for interfaces.

To view information for one or more specific interfaces, go to the Interfaces table, and then click the box to the left of one or more interfaces. The Overall Interface Usage chart automatically refreshes and displays information for the selected interfaces.

To view further details for the interface, click the > Expand icon in the Details column.

Historical Interface Usage
To view usage-over-time information about all interfaces for the device, select the Interfaces > Usage tab, and then select the Historical tab.
The screen displays the following charts and tables:
- SD-WAN Overall Usage over Time
- SD-WAN Overall Traffic Usage
- SD-WAN Application Traffic Usage over Time
- DIA Application Traffic Usage over Time
- SD-WAN Application Traffic Usage Summary (for Releases 11.4.1 and later)
- DIA application traffic Usage Summary (for Releases 11.4.1 and later)

Device Applications
To monitor the applications for an individual device, select View > Dashboard > Secure SD-WAN > Overview, then select the device from the Select an Appliance drop-down list. Select the Applications tab to view the following subtabs:
- Overview—Overview of application information for the device.
- Application Performance (APM)—TCP-based application performance monitoring.
- Audio & Video Performance (MOS)—MOS score monitoring.
- Live Sessions—Currently active TCP and UDP sessions.

Overview of Device Applications
Select the Overview tab to view the following charts and table:
- Top Applications
- Categories
- Business Tags
- Top Applications per Access Circuit over Time
- Application Usage

APM
To monitor APM information for the applications for an individual device, select the Application Performance tab to view the following charts and table:
- TCP Application Performance
- TCP Application Performance over Time
- TCP Application Performance Details

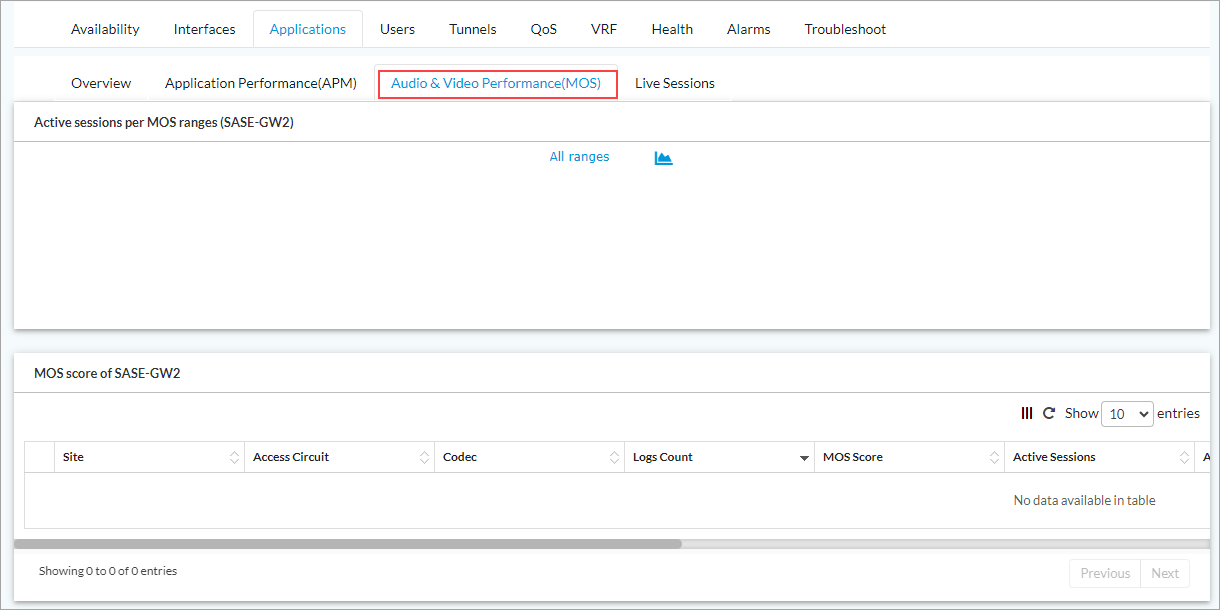
Audio and Video Performance
To monitor audio and video performance (MOS scores) for an individual device, select the Audio & Video Performance tab to view the following chart and table:
- Active Sessions per MOS Range
- MOS Score
Real-Time Sessions Statistics
To monitor currently active TCP and UDP sessions for an individual device, select the Applications tab, and then select the Live Sessions tab, to view the Current Active Sessions table.

To view session statistics, click the value in the Session-Count field.

Device Users
For Releases 11.4.1 and later.
To monitor the users of an individual device, select View > Dashboard > Secure SD-WAN > Overview, and then select the device from the Select an Appliance drop-down list. Select the Users tab to view the following charts and table:
- Top Users—Top users for the device. In some cases, users are identified by their IP address.
- Top Users per Access Circuit over Time—Top users per access circuit for the device.
- Users—Detailed information about user usage for the device.

In the Users table, click the ![]() Zoom icon to the left of a row to view the following charts and table:
Zoom icon to the left of a row to view the following charts and table:
- Usage over Time for username
- Top Applications of the User username
- Applications of username

Device Tunnels
For Releases 11.4.1 and later.
To monitor the site-to-site tunnels for an individual device, select View > Dashboard > Secure SD-WAN > Overview, then select the device from the Select an Appliance drop-down list. Select the Tunnels tab to view the following subtabs:
- Overview
- SLA metrics
- SLA violations
- Rules
- MOS
- QoE
Real-Time Tunnels Overview
Select Tunnels > Overview > RealTime to view the following information:

Historical Tunnels Overview
Select Tunnels > Overview > Historical to view the following chart and table:
- Top Tunnel Usage over Time
- Tunnel Usage

Tunnel SLA Metrics
To monitor SLA metrics for the path between the current device and a remote device, select Tunnels > SLA Metrics, and then select a remote device from the Remote Appliance drop-down list. You can select All from the drop-down list to monitor SLA metrics between the current device and all remote devices.
The screen displays the following chart and table:
- Top SLA Measurement of device
- SLA Measurement of device

To view the SLA metrics between the current site and a remote site, click the ![]() Zoom icon to the left of a row.
Zoom icon to the left of a row.
The screen displays the following information:
- SLA Delay Metrics from device1 to device2
- SLA Loss Ratio Metrics from device1 to device2
- SLA Logs from device1 to device2

Tunnel SLA Violations
To monitor SLA violation events for the path between the current device and a remote device, select Tunnels > SLA Violations, and then select a remote device from the Remote Appliance drop-down list. You can select All from the drop-down list to monitor SLA violations between the current device and all remote devices.
The screen displays the following charts and table:
- Top Paths with Data Path Flaps
- Top Paths from device with Violations
- SLA Path Alarms from device

Tunnel Policy Rules
To view information about site-to-site tunnel policy rules for the current device, select Tunnels > Rules and then in the Remote Appliance drop-down list select All devices or an individual VOS device.
The screen displays the following information:
- Top Rules
- Rules

To view rule details, in the Rules table click the ![]() Zoom icon to the left of a rule.
Zoom icon to the left of a rule.
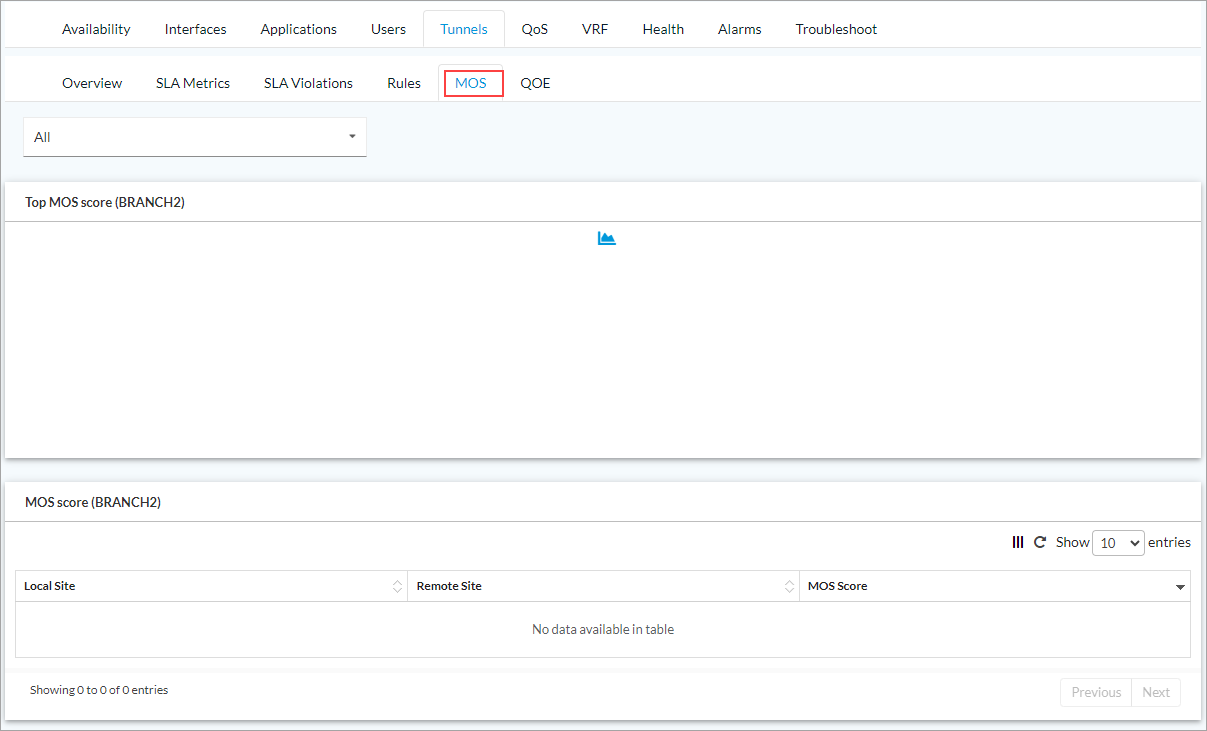
Tunnel MOS Scores
To view information about MOS scores for tunnels between the current device and a remote devices, select Tunnels > MOS, and then select a remote device from the Remote Appliance drop-down list. You can select All from the drop-down list to monitor MOS scores between the current device and all remote devices.
The screen displays the following chart and table:
- Top MOS Score
- MOS Score
Tunnel Quality of Experience (QoE)
To view information about QoE for tunnels between the current device and remote devices, select Tunnels > QoE, and then select a remote device from the Remote Appliance drop-down list. You can select All from the drop-down list to monitor QoE between the current device and all remote devices.
The screen displays the following charts:
- Quality of Experience per Path
- Quality of Experience after SD-WAN Optimization

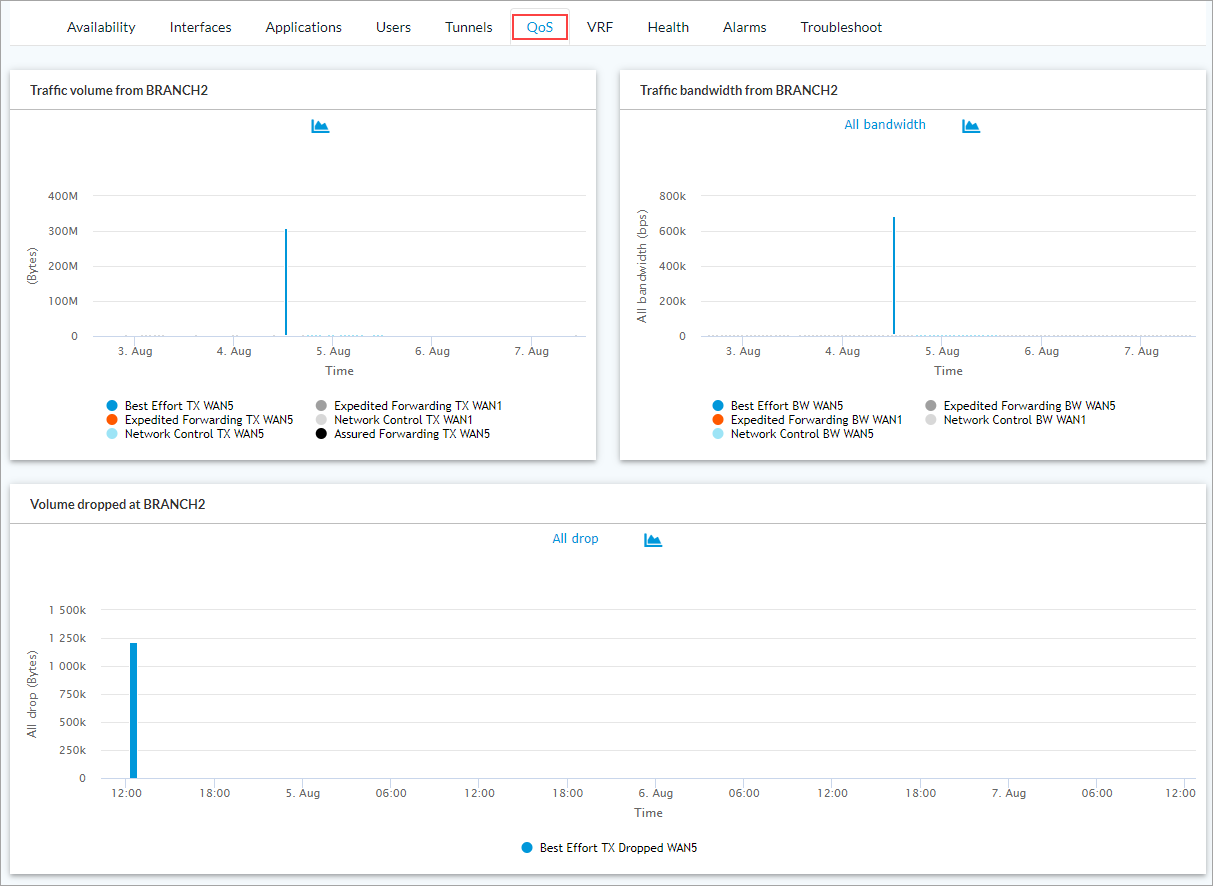
Device QoS
For Releases 11.4.1 and later.
To monitor QoS for an individual device, select View > Dashboard > Secure SD-WAN > Overview, then select the device from the Select an Appliance drop-down list. Select the QoS tab to view the following charts:
- Traffic Volume from device
- Traffic Bandwidth from device
- Volume Dropped at device
Device VRFs
For Releases 11.4.1 and later.
To monitor VRFs for an individual device, select View > Dashboard > Secure SD-WAN > Overview, and then select the device from the Select an Appliance drop-down list. Select the VRF tab to view the following chart and table:
- VRF Usage over Time
- VRF Usage

In the VRF Usage table, click the ![]() Zoom icon to the left of a VRF to view usage details.
Zoom icon to the left of a VRF to view usage details.

Device Health
For Releases 11.4.1 and later.
To monitor the health of an individual device, select View > Dashboard > Secure SD-WAN > Overview, and then select the device from the Select an Appliance drop-down list. Select the Health tab to view the following charts:
- Device Monitoring by CPU Load
- Device Monitoring by Memory Load
- Device Monitoring by Disk Load
- Device Monitoring by Sessions Load

Device Alarms
For Releases 11.4.1 and later.
To monitor the alarms of an individual device, select View > Dashboard > Secure SD-WAN > Overview, and then select the device from the Select an Appliance drop-down list.
Select the Alarms tab to view the Active Alarms table:

In the Active Alarms table, click the arrow to the left of a time stamp to view details for an alarm.

Select the Historic Alarms tab to view the Historic Alarms table.

Troubleshooting Tools
You can access the following troubleshooting tools from the SD-WAN dashboard:
- Ping—Sends ICMP echo requests from the current device to remote devices.
- Traceroute—Sends a sequence of ICMP packets from the current device to remote devices to trace a route.
- Speed Test—Runs a speed test for the current device to a pre-configured remote server or a Versa speed-test server.
Ping a Device
To send a ping from a device:
- Select View > Dashboard > Secure SD-WAN > Overview, then select the device from the Select an Appliance drop-down list.
- Select the Troubleshoot tab, click the Run Ping tab, and then enter information for the following fields.

Field Description Destination Enter the IP address of the destination to which the packets are sent. Interface Select the interface to use as the source address. Optionally, enter the packet size, in bytes.
Range: 0 thorugh 65535 bytes
Default: NonePacket Count Enter the number of packets to send.
Range: 1 through 25
Default: 5Packet Size Enter the packet size, in bytes.
Range: 0 through 65535 bytes
Default: None
- Click Start to run a ping diagnostic test. After the test completes, a screen similar to the following displays.

Traceroute Utility
To run a traceroute from a device:
- Select View > Dashboard > Secure SD-WAN > Overview, then select the device from the Select an Appliance drop-down list.
- Select the Troubleshoot tab, click the Run Traceroute tab, and then enter information for the following fields.

Field Description Destination Enter the IP address or FQDN of the target host. Interface Select the interface that initiates the traceroute.
- Click Start. After the traceroute diagnostic test completes, a screen similar to the following displays.

Speed Test
You can run two types of speed tests for a device:
- Internet speed test—Speed test for devices using predeployed internet speed-test servers. The internet speed test chooses the nearest predeployed speed-test server.
- SD-WAN speed test—Speed test for WAN interface to a Versa speed-test server.
To run a speed test:
- Select View > Dashboard > Secure SD-WAN > Overview, then select the device from the Select an Appliance drop-down list.
- Select the Troubleshoot tab, and then select Run Speed Test.
- To run an internet speed test, select Internet.
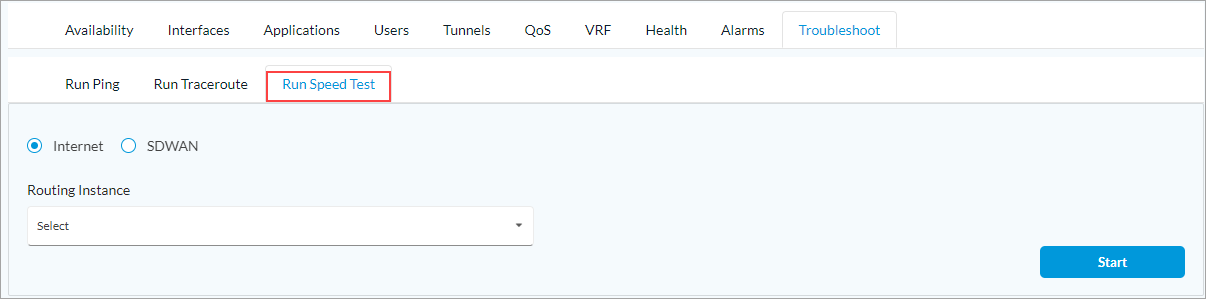
- Select the routing instance to use to connect to the predeployed internet speed-test server.
- Click Start.
- To run an SD-WAN speed test, select SD-WAN, and then enter information for the following fields.

Field Description Local Interface Select the local interface to use for the speed test.
Remote Destination Select the remote destination to use for the speed test. Remote Interface Select the remote interface to use for the speed test. - Click Start. After the speed test diagnostic test completes, a screen similar to the following displays.

Supported Software Information
Releases 11.3.1 and later support all content described in this article, except:
- Release 11.3.2 adds support for downloading CSV files showing information about alarms on SD-WAN devices.
- Release 11.4.1 adds Availability, Users, Tunnels, QoS, VRF, Health, and Alarms tabs in Monitor Device Interfaces. You can select an aggregator node to view analytics that is aggregated from multiple Director instances.
- Release 12.1.1 adds support for digital experience monitoring and routing monitoring.
- Release 12.2.1 adds support for the ATP, Security Alerts, Risk Score, API-DP, Email, and RBI dashboards; you can clear alarms for specific devices; you can download the Tenant Health table to a CSV file.