View Concerto Security Dashboards
![]() For supported software information, click here.
For supported software information, click here.
Concerto collects security statistics for a tenant that you can display from the View tab. For each tenant, the Security tab displays the following information:
- Overview—Summary of security actions and threats.
- Alerts—Dashboard for viewing and clearing alerts.
- Internet protection—Statistics for internet protection rules by web, firewall, threat filtering, threat detection, and data loss prevention (DLP).
- Private application protection—Statistics for private applications and usage, or private applications by users.
- Risk score—Risk scores for shadow IT discovery, entity confidence scores, and user confidence scores.
- API-based data protection—Information about event-based and schedule-based data protection for IaaS and SaaS applications.
- Email protection—Information about detection, prevention, and responses to cyber attacks that are delivered through email.
- Remote browser isolation (RBI)—Information about RBI activities.
Security Dashboard Parameters
For many Security dashboards, you can select the following data parameters:
- Define the dashboard data source.
- Limit output to a single device.
- Define the time frame for dashboard maps, charts, and statistics.
To select dashboard parameters, go to View > Dashboard > Security, and then select values for the following fields (shown below):
- In the first drop-down list, select a DCA complex to use its Analytics cluster as the data source.
For releases 11.4.1 and later, if an Analytics aggregator cluster is configured, you can select it to view combined data from multiple DCA complexes. - In the second drop-down list, select an individual VOS device (appliance) for which you want to view data. By default, the displayed data is for all appliances.
- In the third drop-down list, select the time frame for which you want to view data.

View Security Overview Information
To view an overview of security information, select View > Dashboard > Security > Overview.
You can view information for the following categories:
- Security summary
- Security threats
Security Summary
To view a summary of security information, select View > Dashboard > Security > Overview > Summary.
The screen displays the following charts:
- Firewall Actions Over Time
- Top Applications
- Top URL Categories
- Top Rules
- Application Risk
- Application Productivity
- Top Application Families

Security Threats
To view an overview of security threats, select View > Dashboard > Security > Overview > Threats.
The screen displays the following information:
- Security threat statistics:
- Threat types
- Critical severity threats
- High severity threats
- Major severity threats
- Medium severity threats
- Geographic map with threat events and deny-source locations. See Threat Map, below.
- Charts for the following security threat information:
- Threat Activity Over Time
- Top Threat Types
- Alerts by Severity
- Top Infected Applications
- Top Users With Threats

Threat Map
You can use the threat map to view threats by threat event or deny-source location. You can drill down to display threat details.
To toggle the map between threat events and deny-source locations, select Threat Events or Deny Source Location from the drop-down list. When multiple items are geographically close, they are grouped in a single circle.

Click a circle to view details for that area, as shown below.

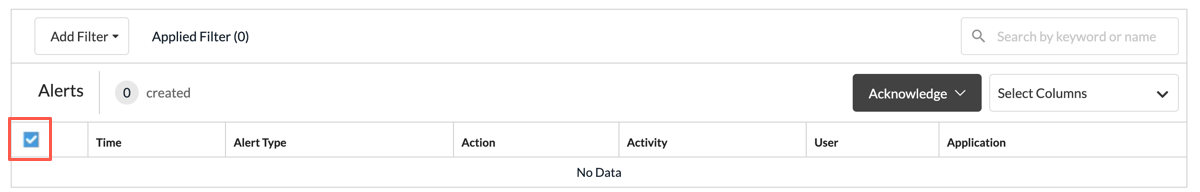
View Security Alerts Information
For Releases 12.2.1 and later.
Security alerts are messages about activities for security features such as advanced threat protection (ATP), data loss prevention (DLP), and URL filtering.
To view and clear alerts, select View > Dashboard > Security > Alerts.

To clear an alert from the table, select the alert by clicking the box to the left, and then select Acknowledge Selected from the Acknowledge drop-down list. You can select multiple alerts to clear them all at once.
To select all alerts displayed on the current screen, click the box in the first column header.
View Internet Protection Information
Internet protection rules are firewall rules that are applied to internet-bound traffic on a per-tenant basis. The rules use match criteria to determine the enforcement actions to apply to the traffic. You can view internet protection information in the following categories:
- Web Protection
- Firewall
- Threat Filtering
- Threat Detection
- DLP
Web Protection
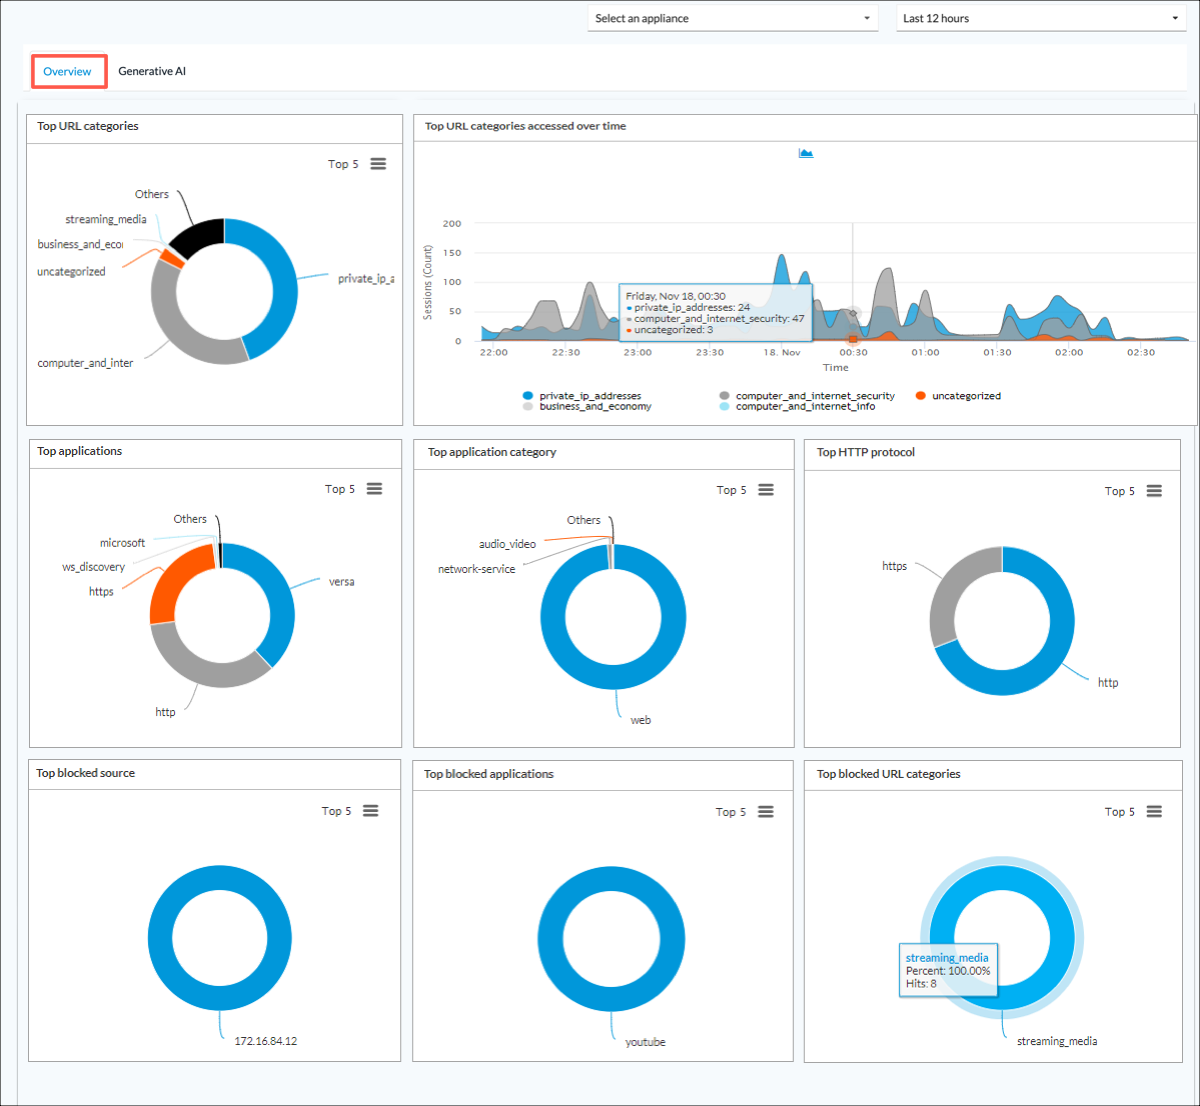
For an overview of web protection information, select View > Dashboard > Security > Internet Protection > Web Overview.
The screen displays the following tabs:
- Overview
- Generative AI
Web Overview
To view information about rule hits for web categories, select View > Dashboard > Security > Internet Protection > Web Overview > Overview.
The following charts display:
- Top URL Categories
- Top URL Categories Accessed Over Time
- Top Applications
- Top Application Category
- Top HTTP Protocol
- Top Blocked Source
- Top Blocked Applications
- Top Blocked URL Categories
Generative AI
For Releases 12.2.1 and later.
To view information about rule hits for generative AI, select View > Dashboard > Security > Internet Protection > Web Overview > Generative AI.
The following charts display:
- Generative AI Category Usage Over Time
- Generative AI URL Reputation
- Generative AI Tools
- Generative AI Policy Actions

Firewall
To view firewall information, select View > Dashboard > Security > Internet Protection > Firewall Overview.
The screen displays the following tabs:
- Rules
- Source
- Destination
- Zones
- Forwarding class
Rule Usage
To view firewall rule usage, select View > Dashboard > Security > Internet Protection > Firewall Overview > Rules.
The screen displays the following chart and table:
- Rule Usage Over Time
- Rule Usage

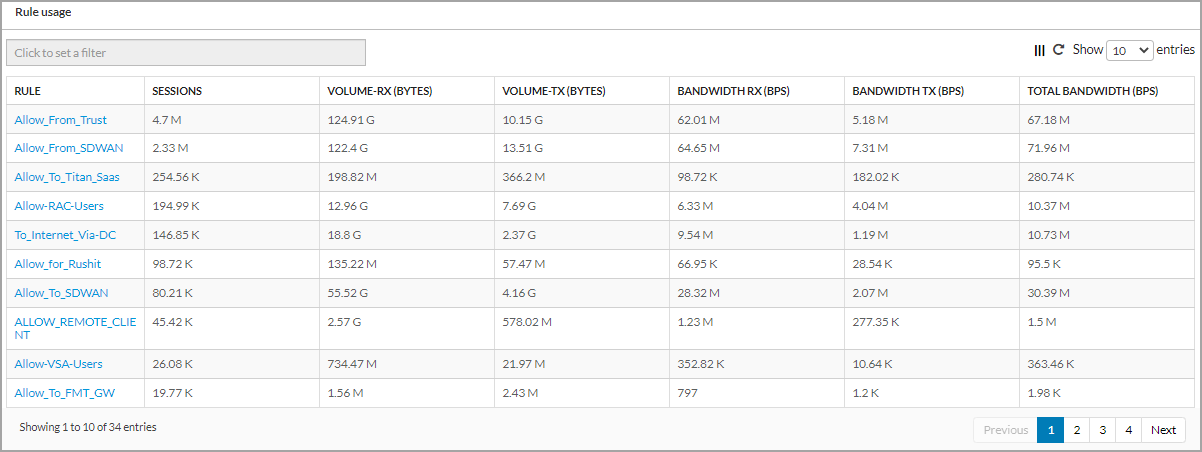
In the Rule Usage table, click a rule name to view the following chart and table:
- Rule Usage Over Time
- Rule Logs (Releases 13.1.1 and later.)
For example:

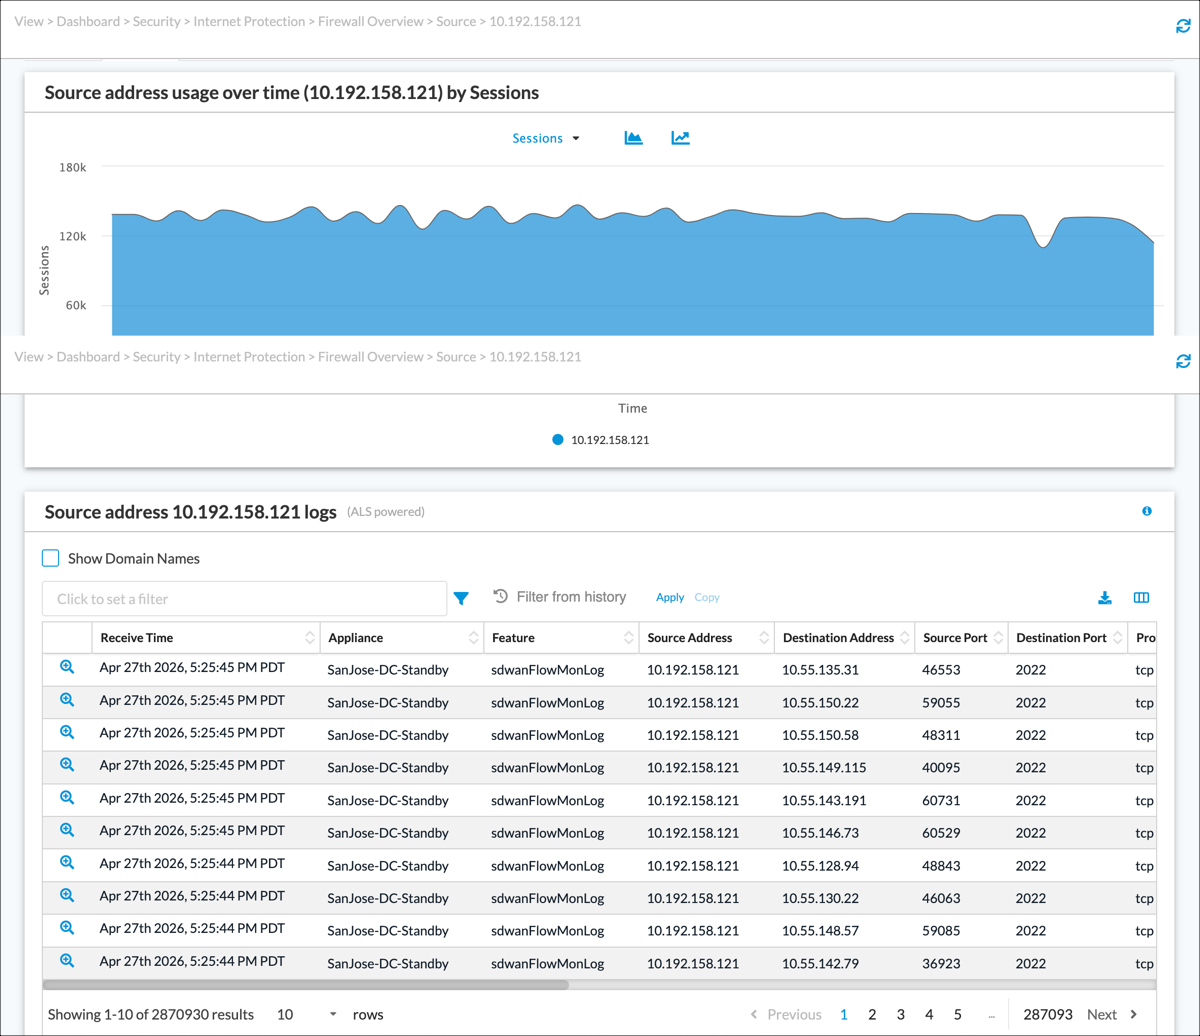
Source IP
To view firewall source IP information, select View > Dashboard > Security > Internet Protection > Firewall Overview > Source.
The screen displays the Source IP Usage table.

In the Source IP Usage table, click a source address to view the following chart and table:
- Source Address Usage Over Time
- Source Address Logs (Releases 13.1.1 and later.)
Destination IP
To view firewall destination IP information, select View > Dashboard > Security > Internet Protection > Firewall Overview > Destination.
The screen displays the Destination IP Usage table.

In the Destination IP Usage table, click a destination address to view the following chart and table:
- Destination Address Usage Over Time
- Destination Address Logs (Releases 13.1.1 and later.)

Zone
To view firewall zone information, select View > Dashboard > Security > Internet Protection > Firewall Overview > Zones.
The screen displays the Zone Usage Over Time chart and Zone Usage table.


In the Zone Usage table, click a zone to view the Zone Usage Over Time chart.

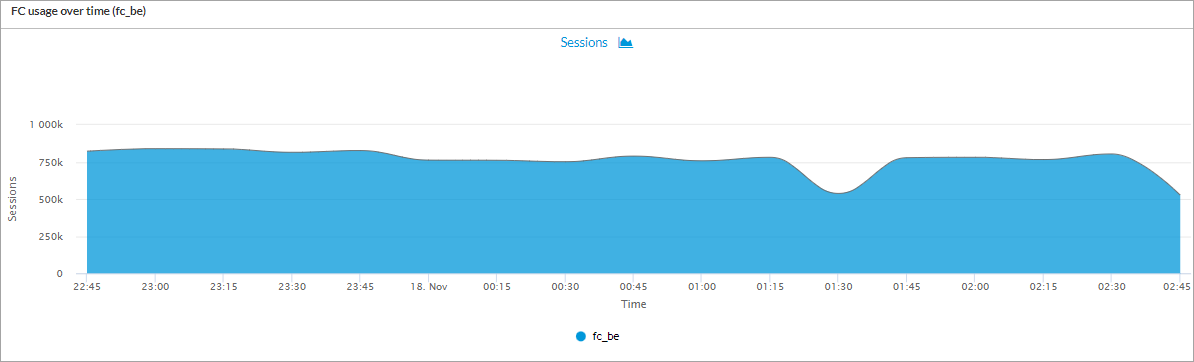
Forwarding Class
To view firewall information by forwarding class, select View > Dashboard > Security > Internet Protection > Firewall Overview > Forwarding Class.
The screen displays the following chart and table:
- FC Usage Over Time
- FC Usage

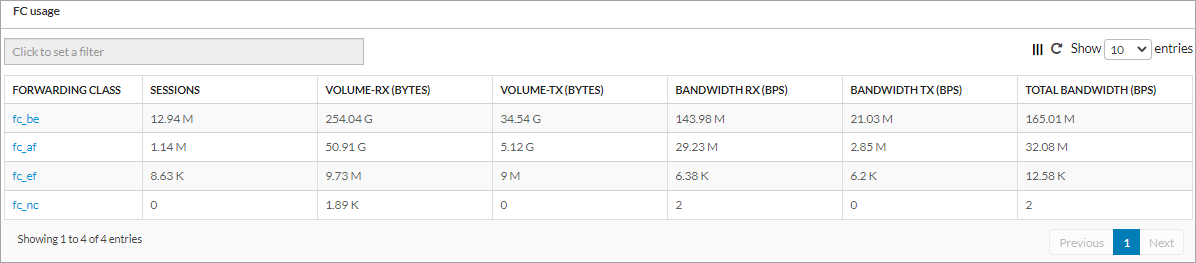
In the FC Usage table, click a forwarding class to view the following chart.
Threat Filtering
To view information about threat filtering, select View > Dashboard > Security > Internet Protection > Threat Filtering.
The Threat Filtering dashboard displays the following tabs:
- Web
- IP
- File
- DNS
- CASB
Web Activities
To view threat filtering information for web activities, select View > Dashboard > Security > Internet Protection > Threat Filtering > Web.
The screen displays the following charts:
- Top URL Categories
- Top URL Reputation
- Top URL Filtering Profiles
- Top URL Filtering Source

IP Filtering
To view IP filtering information, select View > Dashboard > Security > Internet Protection > Threat Filtering > IP.
The screen displays the following charts:
- Top IP Filtering Action
- Top IP Filtering Profiles
- Top IP Filtering Destination Reputation
- Top IP Filtering Source

File Filtering
To view file filtering information, select View > Dashboard > Security > Internet Protection > Threat Filtering > File.
The screen displays the following charts:
- Top File Filtering Action
- Top File Filtering Profiles
- Top File Types
- Top File Filtering Source

DNS Filtering
To view DNS filtering information, select View > Dashboard > Security > Internet Protection > Threat Filtering > DNS.
The screen displays the following charts:
- Top DNS Filtering Profiles
- Top DNS Filtering Message Types
- Top DNS Fiiltering Action
- Top DNS Filtering Domains

CASB
To view information about cloud access security broker (CASB) activities, select View > Dashboard > Security > Internet Protection > Threat Filtering > CASB.
The screen displays the following charts:
- Top CASB Application
- Top CASB Action
- Top CASB Users
- Top CASB Rules

Threat Detection
The Threat Filtering screen displays the following information:
- Malware—Statistics for top antivirus malware, infected applications, victims, and attackers.
- Vulnerabilities—Statistics for top threats, signature ID, source, and destination.
- Distributed denial-of-service (DDoS)—Statistics for DDoS attacks.
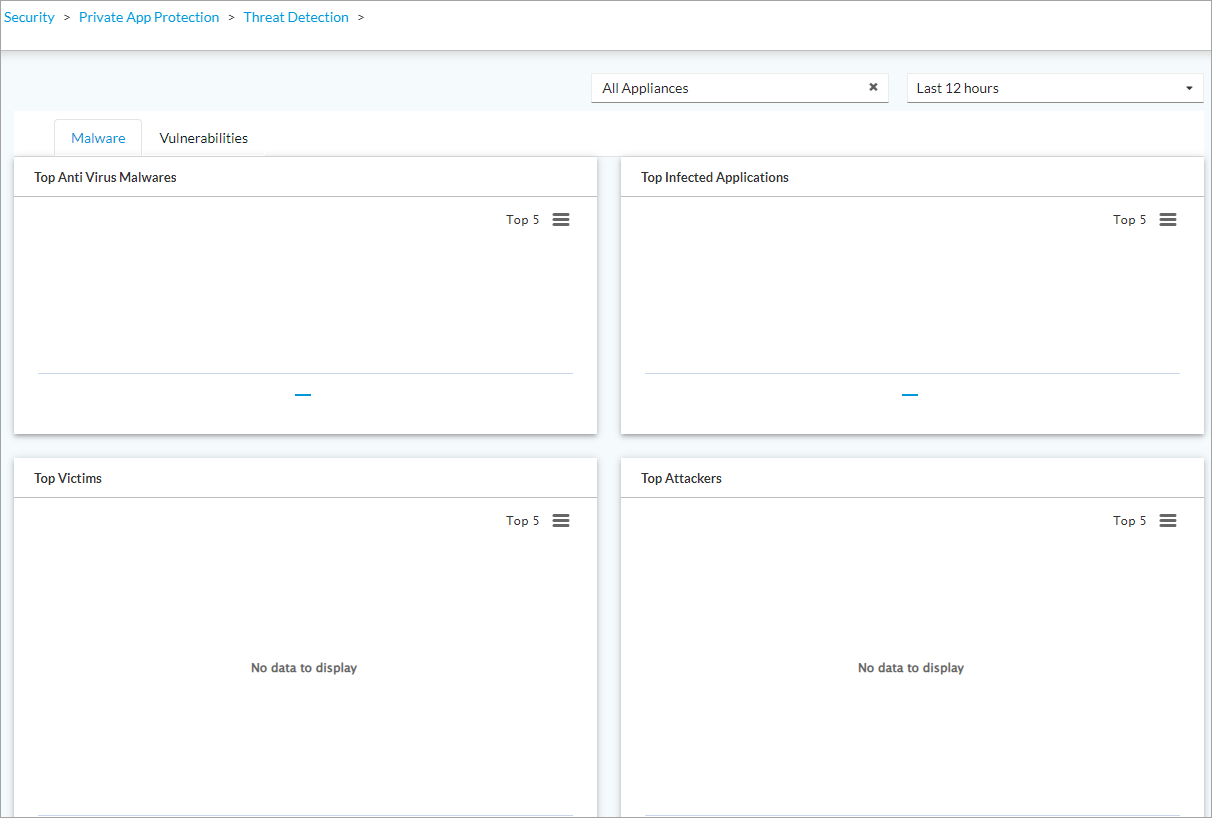
Malware
To view information about malware detection, select View > Dashboard > Security > Internet Protection > Threat Detection > Malware.
The following charts display:
- Top Antivirus Malwares
- Top Infected Applications
- Top Victims
- Top Attackers


Vulnerabilities
To view information about malware detection, select View > Dashboard > Security > Internet Protection > Threat Detection > Vulnerabilities.
The following charts display:
- Top Threats
- Top Signature ID
- Top Source
- Top Destination

ATP
(For Releases 12.2.1 and later.)
To view information about ATP threat detection, select View > Dashboard > Security > Internet Protection > Threat Detection > ATP.
The following charts display:
- Top ATP Analysis Type
- Top ATP Stages
- Top ATP Sources
- Top ATP Verdicts
- Top ATP Applications
- Top ATP Action

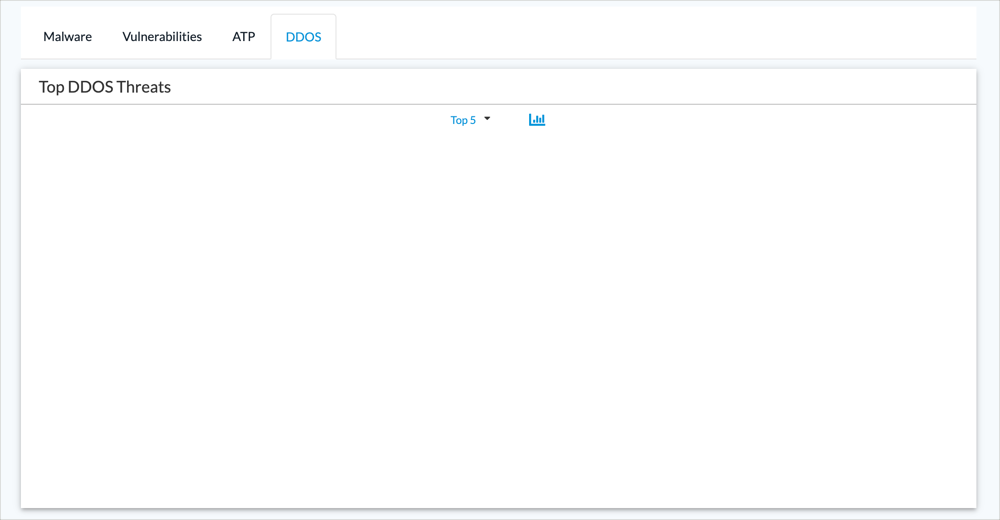
DDoS Threats
To view information about DDoS threats, select View > Dashboard > Security > Internet Protection > Threat Detection > DDOS.
The screen displays the Top DDoS Threats chart.
DLP
Data loss prevention (DLP) is a set of tools and processes for detecting and preventing data breaches, cyber exfiltration, and unwanted destruction of sensitive data. For more information, see Configure Data Loss Prevention in Concerto.
To view DLP information , select View > Dashboard > Security > Internet Protection > DLP.
The following charts display:
- Top DLP Applications
- Top DLP Action
- Top DLP Users
- Top DLP Data Profiles

View Private Application Protection Information
To view private application protection information, select View > Dashboard > Security > Private App Protection.
The screen displays the following tabs:
- Applications
- Users
Private Applications
To view private application protection information, select View > Dashboard > Security > Private App Protection > Applications.
The screen displays the following tabs:
- Applications
- Users
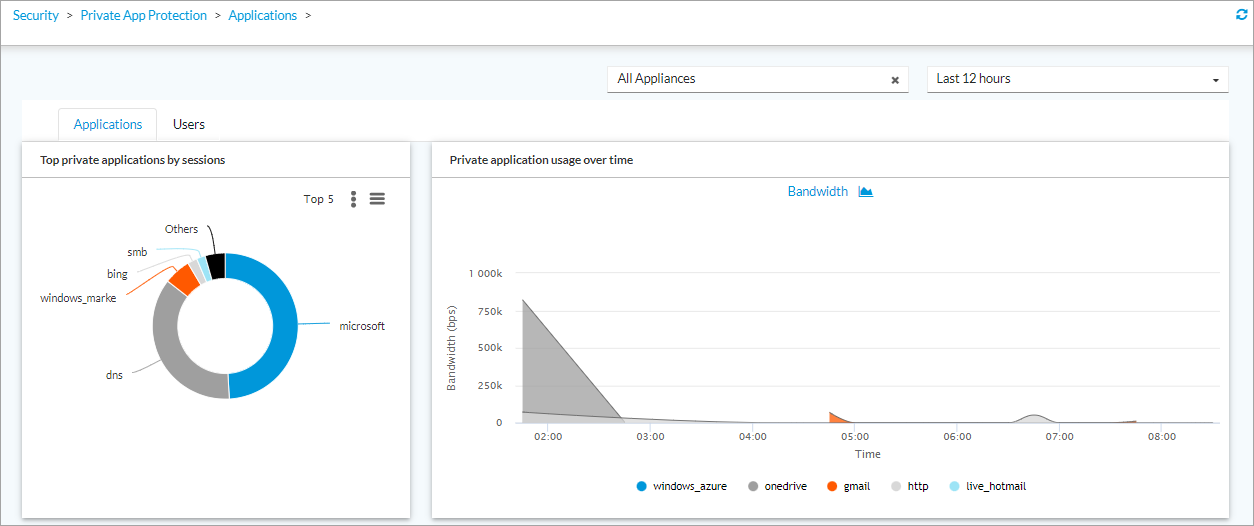
Application Usage
To view information about protection for private applications, select View > Dashboard > Security > Private App Protection > Applications > Applications.
The following charts and table display:
- Top Private Applications by Sessions
- Private Application Usage over Time
- Private Application Usage

In the Private Application Usage table or in the Top Private Applications by Sessions graph, click an application to view the following charts and table:
- Private Application application-name Usage Over Time
- Private Application application-name Top Users by Sessions
- Private Application application-name Users Usage

Application Users
To view information about users of private applications, select View > Dashboard > Security > Private App Protection > Applications > Users.
The following charts and table display:
- Top Users of Private Applications
- Private Application Users Usage Over Time
- Private application Users Usage
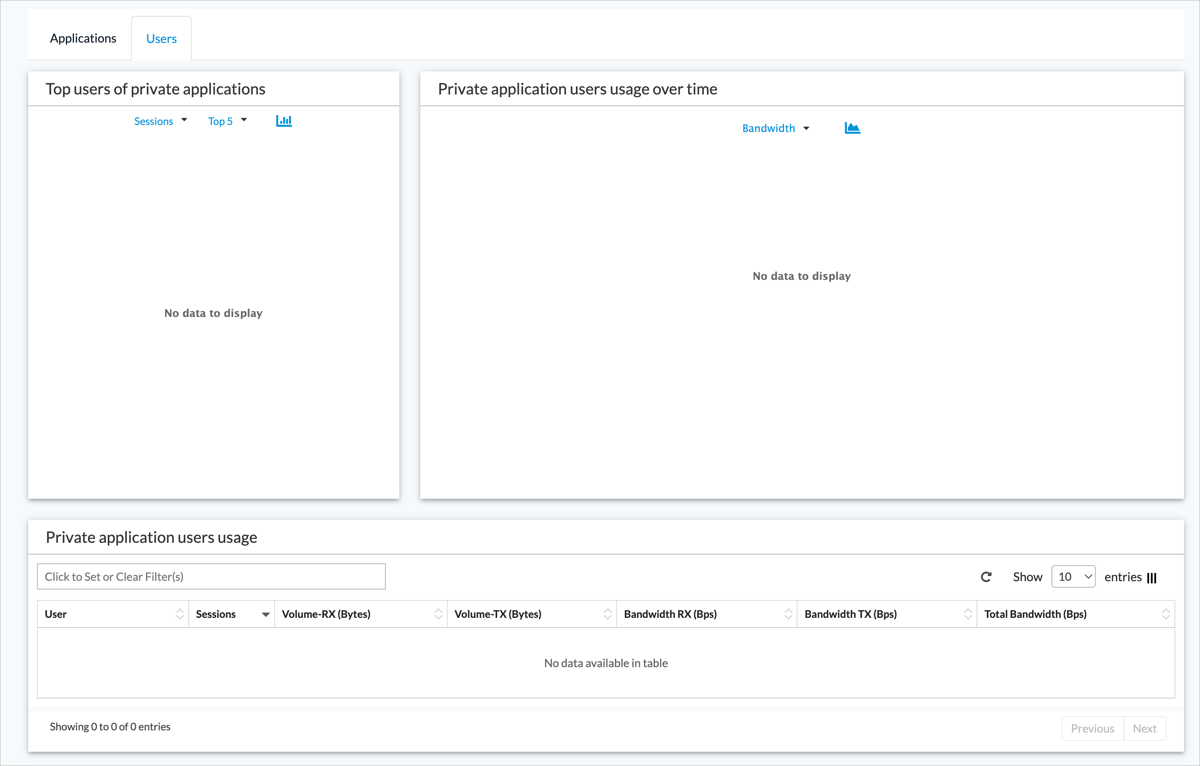
In the Private Application Users Usage table or in the Top Users of Private Applications chart, click a user name to display details about the private application usage for the user, as shown below.

Private Application Threat Detection
To view private application protection information, select View > Dashboard > Security > Private App Protection > Threat Detection.
The screen displays the following tabs:
- Malware
- Vulnerabilities
Malware
To view information about malware threats, select View > Dashboard > Security > Private App Protection > Threat Detection > Malware.
The Malware tab displays the following information:
- Top Antivirus Malwares
- Top Infected Applications
- Top Victims
- Top Attackers
Vulnerabilities
To view information about vulnerabilities, select View > Dashboard > Security > Private App Protection > Threat Detection > Vulnerabilities.
The Vulnerabilities tab displays the following charts:
- Top Threats
- Top Signature ID
- Top Source
- Top Destination

View Risk Score Information
For Releases 12.2.1 and later.
To view information about security risk scores, select View > Dashboard > Security > Risk Score.
You can display information in the following categories:
- Shadow IT Discovery
- Entity Confidence Score
- User Confidence Score
Shadow IT Discovery
To view shadow IT discovery ratings for applications, select View > Security > Risk Score> Shadow IT.
For information about configuring shadow IT discovery, see Update and View Shadow IT Discovery.
The top row displays summaries of ratings for all applications, grouped by rating category: all, excellent, great, good, and low. All other rows display panes with shadow IT ratings for specific applications.

Entity Confidence Score
To view statistics for entity confidence scores, select View > Dashboard > Security > Risk Score> Entity Confidence Score, and then select a device from the first drop-down list. You can also select a time period from the second drop-down list. The following screen displays.

User Confidence Score
To view statistics for user confidence scores, select View > Security > Risk Score> User Confidence Score.

View API-Based Data Protection Information
For Releases 12.2.1 and later.
To view information about API-based data protection (API-DP), also known as API CASB and offline CASB, select View > Dashboard > Security > Advanced Security> API Based Data Protection.
SaaS Applications
To view statistics and charts for SaaS applications, select View > Dashboard > Security > Advanced Security> API Based Data Protection > SaaS.
The following tabs display:
- Application View
- User View (Releases 13.1.1 and later.)
- Global View (Releases 13.1.1 and later.)
Application View
Select the Application View tab to view information for SaaS applications.

Click a SaaS application instance to view information specific to the instance. For example, clicking the Box application displays the following screen.

The following table lists SaaS applications and the statistics and charts displayed for each application.
| Application | Statistics | Charts |
|---|---|---|
| Azure Communication Services (ACS) Email Proxy |
|
|
| Box |
|
|
| Cisco Webex |
|
|
| Confluence |
|
|
| Egnyte |
|
|
| Gmail |
|
|
| Google Drive |
|
|
| Jira |
|
|
| Microsoft OneDrive |
|
|
| Microsoft Outlook |
|
|
| Microsoft Sharepoint |
|
|
| Microsoft Teams |
|
|
| Microsoft Yammer |
|
|
| Salesforce |
|
|
| Slack |
|
|
| Trello |
|
|
| Zoom |
|
|
User View
For Releases 13.1.1 and later.
Select View > Dashboard > Security > Advanced Security> API Based Data Protection > SaaS, and then select the User View tab to view information for SaaS users.

Global View
For Releases 13.1.1 and later.
Select View > Dashboard > Security > Advanced Security> API Based Data Protection > SaaS, and then select the Global View tab to view information about SaaS users and applications.
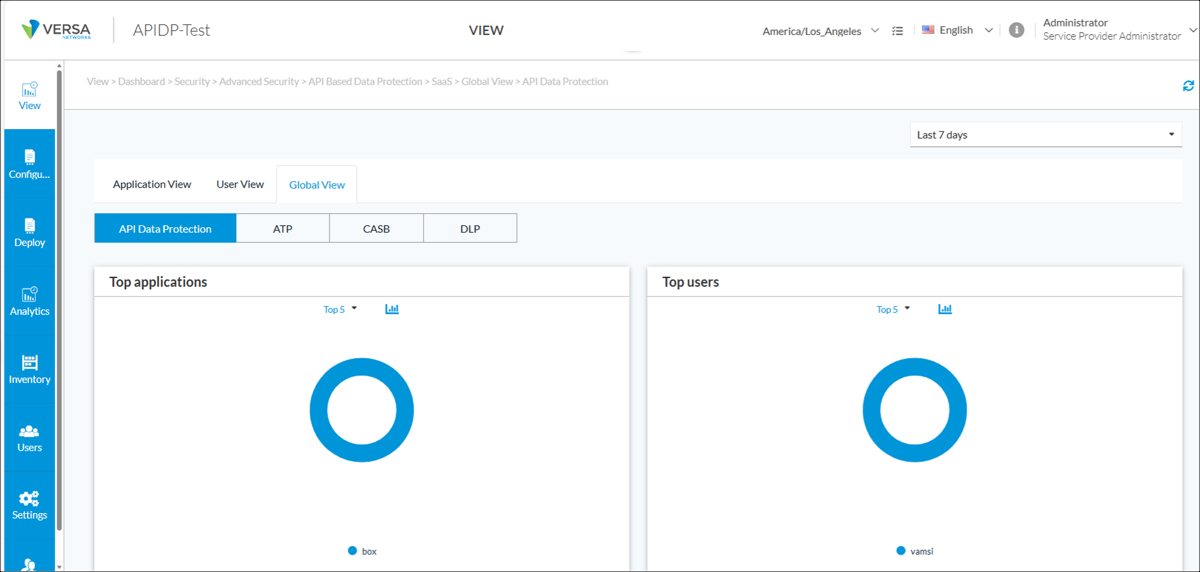
The dashboard displays the following tabs:
- API Data Protection
- ATP
- CASB
- DLP
The API Data Protection tab displays the following charts:
- Top Applications
- Top Users
- Top Rules
- Top Actions
- Cloud Security Events
The ATP tab displays the following charts:
- ATP Top Applications
- ATP Top Users
- ATP Top Malware
- ATP Top Threats
- ATP Top Verdicts
- ATP Top Actions
- ATP Top File Types
- ATP Top Rules
- ATP Top Stages
The CASB tab displays the following charts:
- CASB Top Applications
- CASB Top Users
- CASB Top Rules
- CASB Top Alerts
- CASB Top Actions
- CASB Top Activity Over Time
The DLP tab displays the following charts:
- DLP Top Applications
- DLP Top Users
- DLP Top Rules
- DLP Top Alerts
- DLP Top Actions
- DLP Top Match Types
IaaS Instances
To view information for IaaS instances, select View > Dashboard > Security > Advanced Security> API Based Data Protection > IaaS.
The following tabs display:
- Application View
- Global View (Releases 13.1.1 and later.)
Application View
Select the Application View tab to view information for IaaS applications. (In Releases 12.2.2 and earlier, the application view information displays by default.)
For each IaaS application, the screen displays summary statistics for its associated IaaS instances. The screen displays the number of IaaS instances and the total number of CASB, DLP, and ATP alerts for these instances.
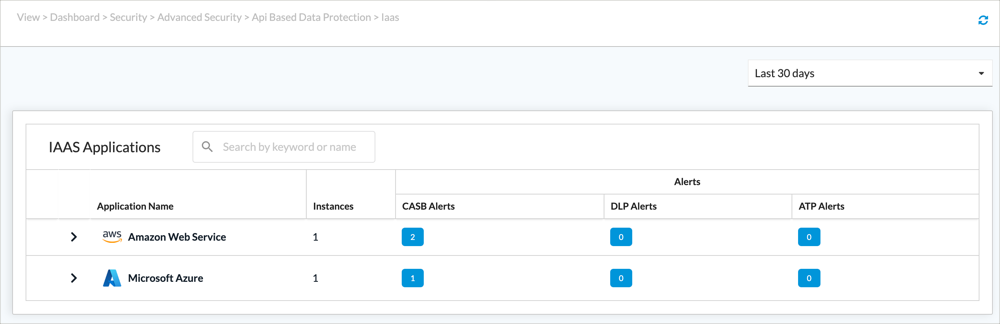
Click an application name to view a list of instances. Statistics vary by provider. For example, for Microsoft Azure, the screen displays the number of IaaS instances and the total number of CASB, DLP, and ATP alerts for these instances.

Click an instance name to view charts for that instance. The charts displayed are specific to the IaaS application.
In the example below, the Azure instance charts include Top Users with Violations, DLP Actions, CASB Actions, and ATP Actions.

Global View
Releases 13.1.1 and later.
Select View > Dashboard > Security > Advanced Security> API Based Data Protection > IaaS, and then select the Global View tab to view the following dashboard.

The dashboard displays the following tabs:
- API Data Protection
- ATP
- CASB
- DLP
The API Data Protection tab displays the following charts:
- Top Applications
- Top Users
- Top Rules
- Top Actions
- Cloud Security Events
The ATP tab displays the following charts:
- ATP Top Applications
- ATP Top Users
- ATP Top Malware
- ATP Top Threats
- ATP Top Verdicts
- ATP Top Actions
- ATP Top File Types
- ATP Top Rules
- ATP Top Stages
The CASB tab displays the following charts:
- CASB Top Applications
- CASB Top Users
- CASB Top Rules
- CASB Top Alerts
- CASB Top Actions
- CASB Top Activity Over Time
The DLP tab displays the following charts:
- DLP Top Applications
- DLP Top Users
- DLP Top Rules
- DLP Top Alerts
- DLP Top Actions
- DLP Top Match Types
View Email Protection Information
For Releases 12.2.1 and later.
Email protection detects, prevents, and responds to cyberattacks that are delivered through email. Common security threats for inbound email include spam, phishing, ransomware, business email compromise (BEC), and other inbound threats. Email protection also protects data and secures outbound traffic.
To view information about email protection activities, select View > Dashboard > Security > Advanced Security > Email Protection.
You can view email protection information in the following categories :
- Overview
- DLP
- CASB
- ATP
- SMTP Proxy
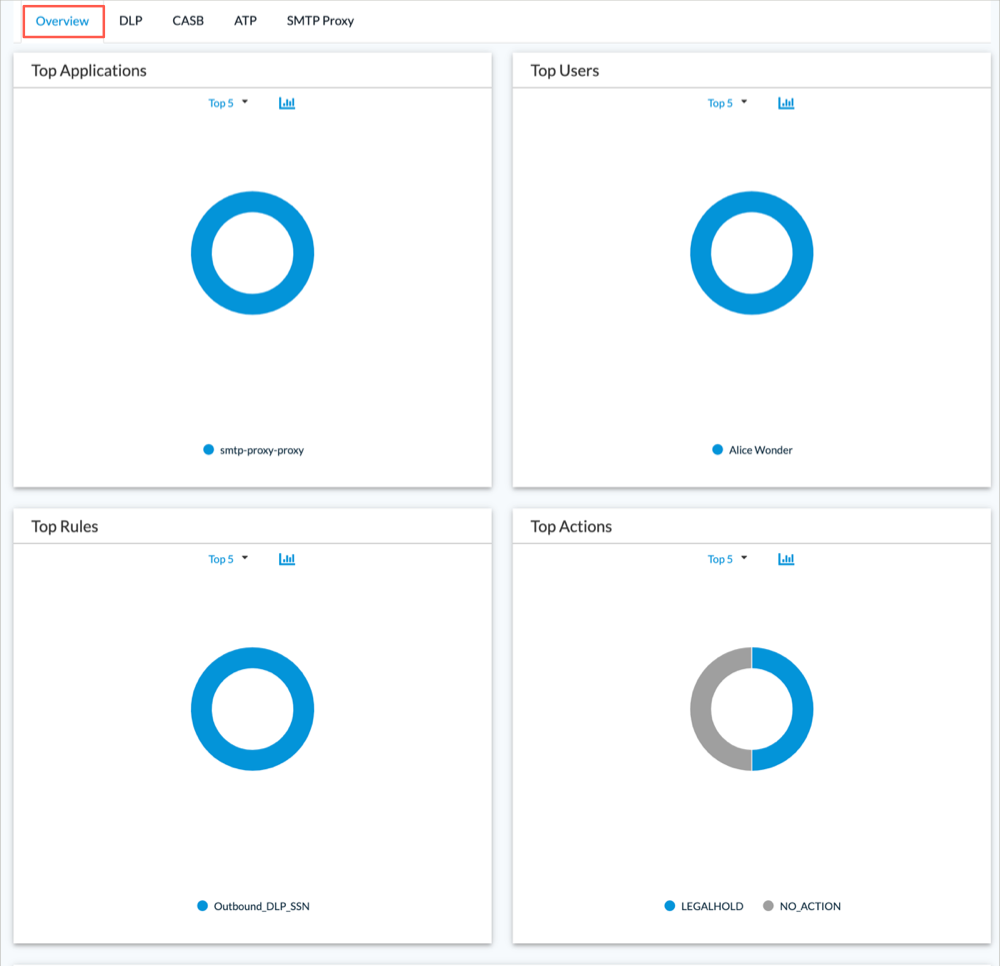
Email Protection Overview
To view email protection overview information, select View > Dashboard > Security > Advanced Security > Email Protection > Overview.
The screen displays the following charts:
- Top Applications
- Top Users
- Top Rules
- Top Actions
DLP
To view DLP email protection information, select View > Dashboard > Security > Advanced Security > Email Protection > DLP.
The screen displays the following charts:
- Top Applications
- Top Users
- Top Rules
- Top Actions

CASB
To view CASB email protection information, select View > Dashboard > Security > Advanced Security > Email Protection > CASB.
The screen displays the following charts:
- Top Applications
- Top Users
- Top Rules
- Top Actions

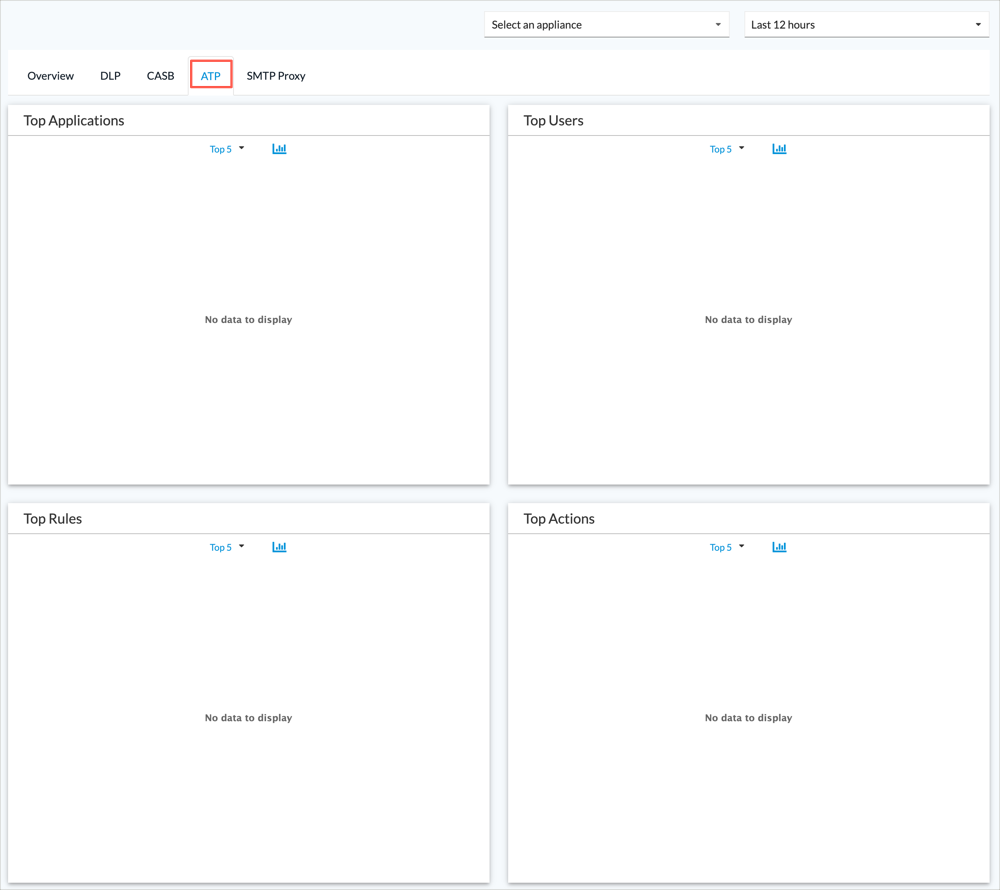
ATP
To view ATP email protection information, select View > Dashboard > Security > Advanced Security > Email Protection > ATP.
The screen displays the following charts:
- Top Applications
- Top Users
- Top Rules
- Top Actions
SMTP Proxy
To view SMTP proxy email protection information, select View > Dashboard > Security > Advanced Security > Email Protection > SMTP Proxy.
The screen displays the following charts:
- SMTP Client Service Type
- SMTP Proxy Events
- SMTP Proxy Events Over Time
- Senders of Denied Emails
- Receivers of Denied Emails

View RBI Information
For Releases 12.2.1 and later.
To view information about remote browser isolation (RBI) activities, select View > Dashboard > Security > Advanced Security > Remote Browser Isolation.
You can view RBI information in the following categories:
- Summary
- Session Logs
- File Transfer Logs
- Active Session
- Threats
RBI Summary
To view RBI summary information, select View > Dashboard > Security > Advanced Security> Remote Browser Isolation > Summary.
The screen displays the following charts:
- Top RBI Browsers
- Top RBI URL Categories
- Top RBI URL Reputation
- Top Users
To view detailed information for a value in the charts displayed above, click the value in a chart. The screen displays a sessions-over-time chart and a table of logs for the value.
For example, the following screen displays the result of clicking Safari in the Top RBI Browsers chart.

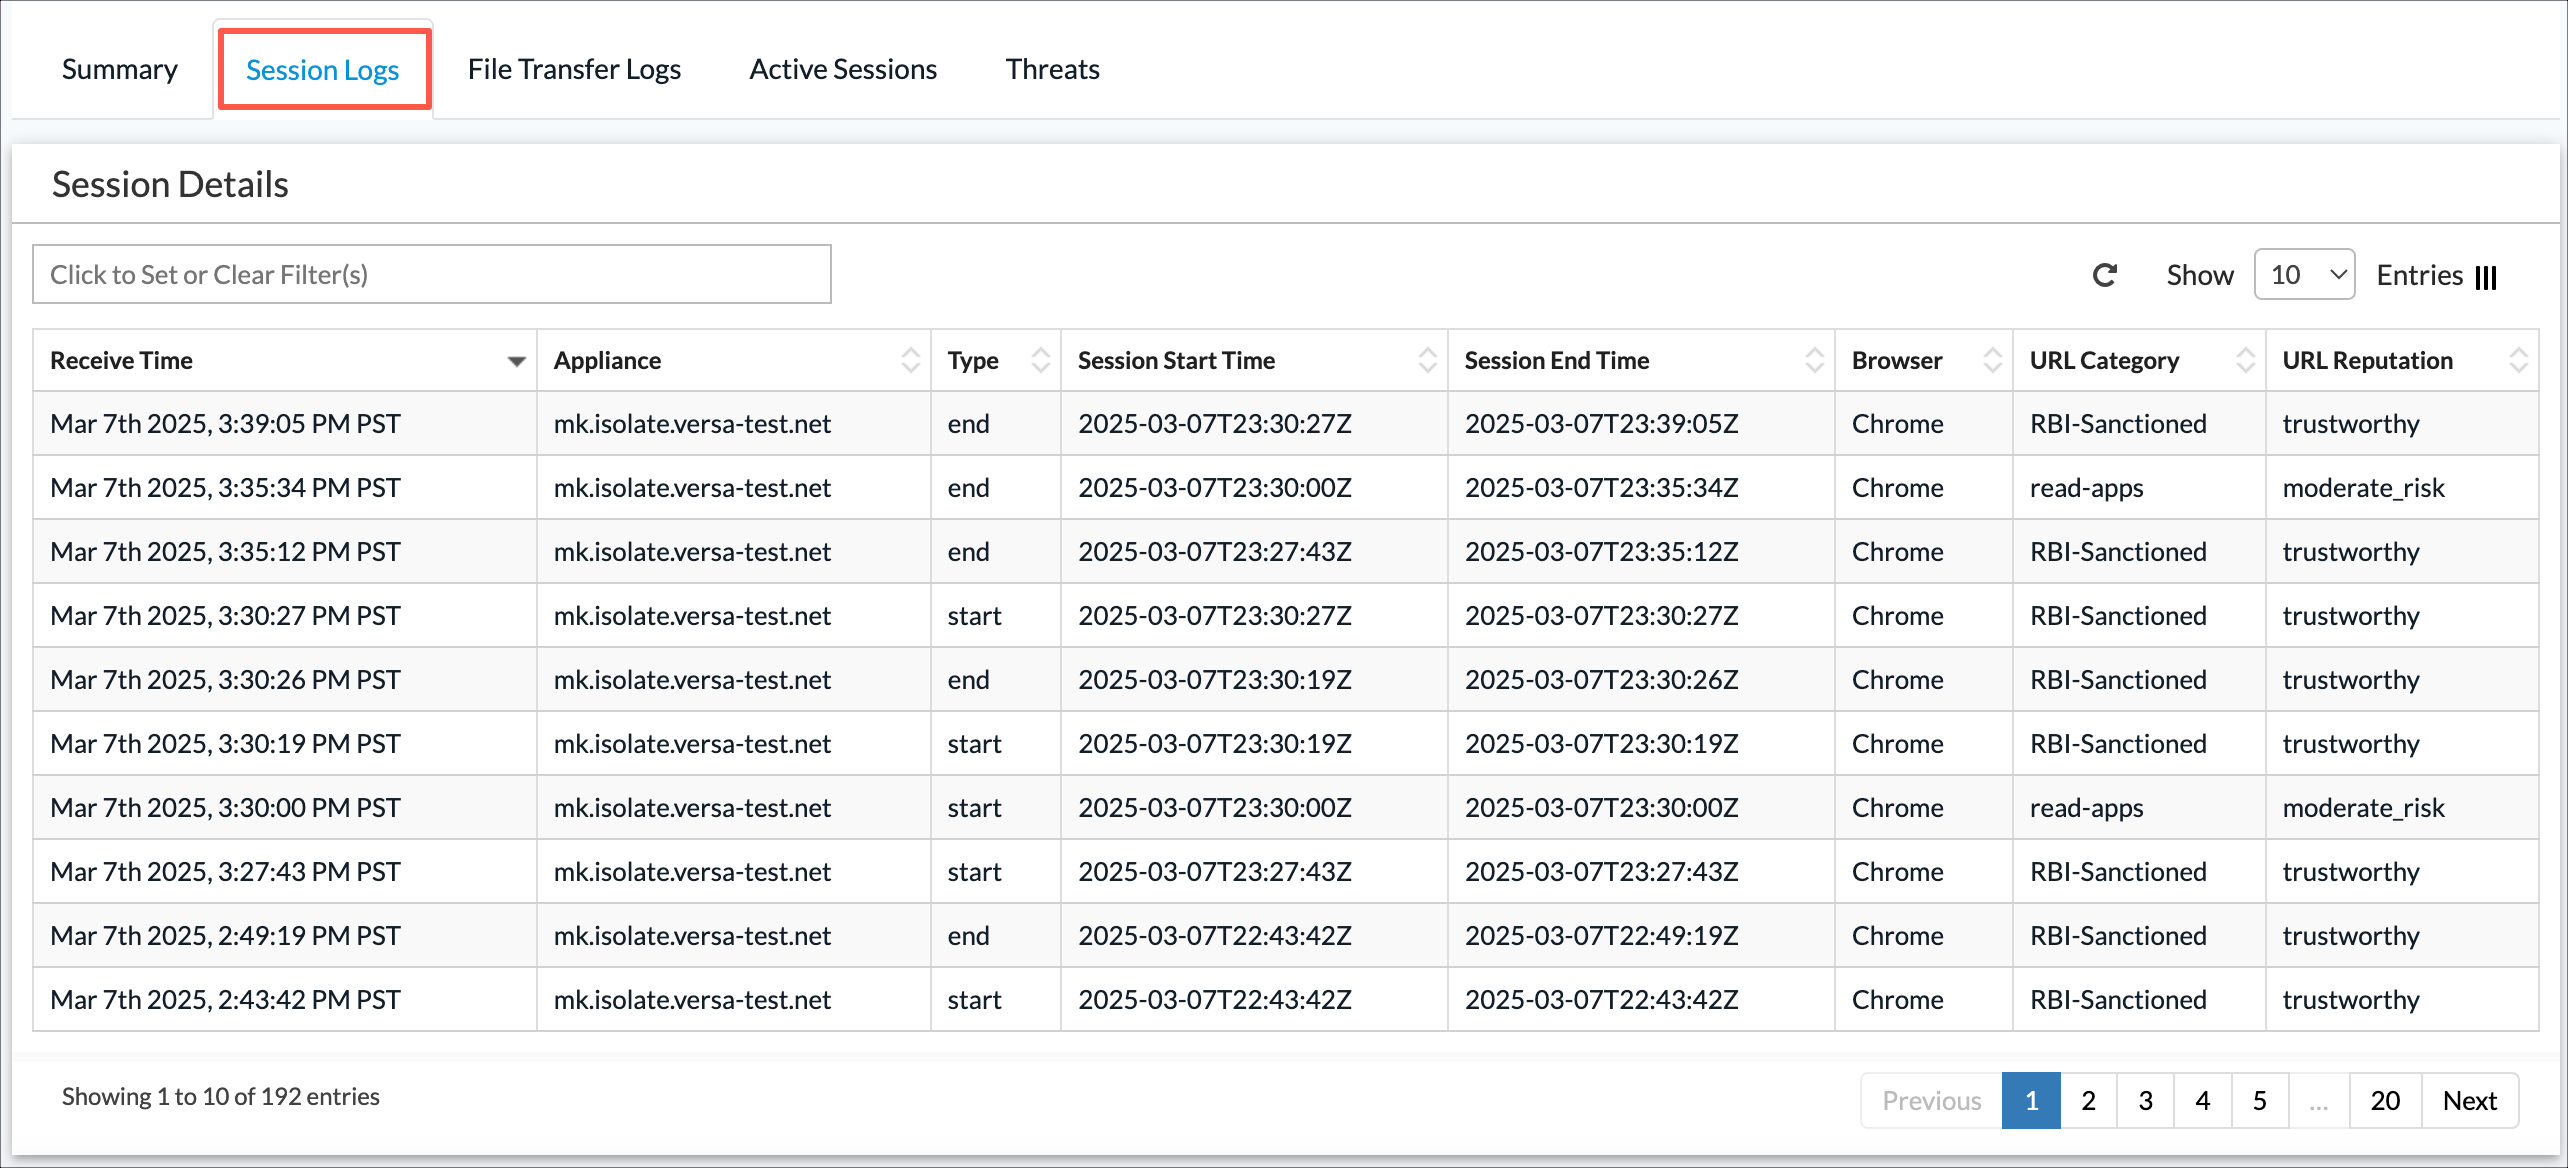
RBI Session Logs
To view RBI session logs, select View > Dashboard > Security > Advanced Security> Remote Browser Isolation > Session Logs.
RBI File Transfer Logs
To view RBI file transfer logs, select View > Security > Advanced Security> Remote Browser Isolation > File Transfer Logs.

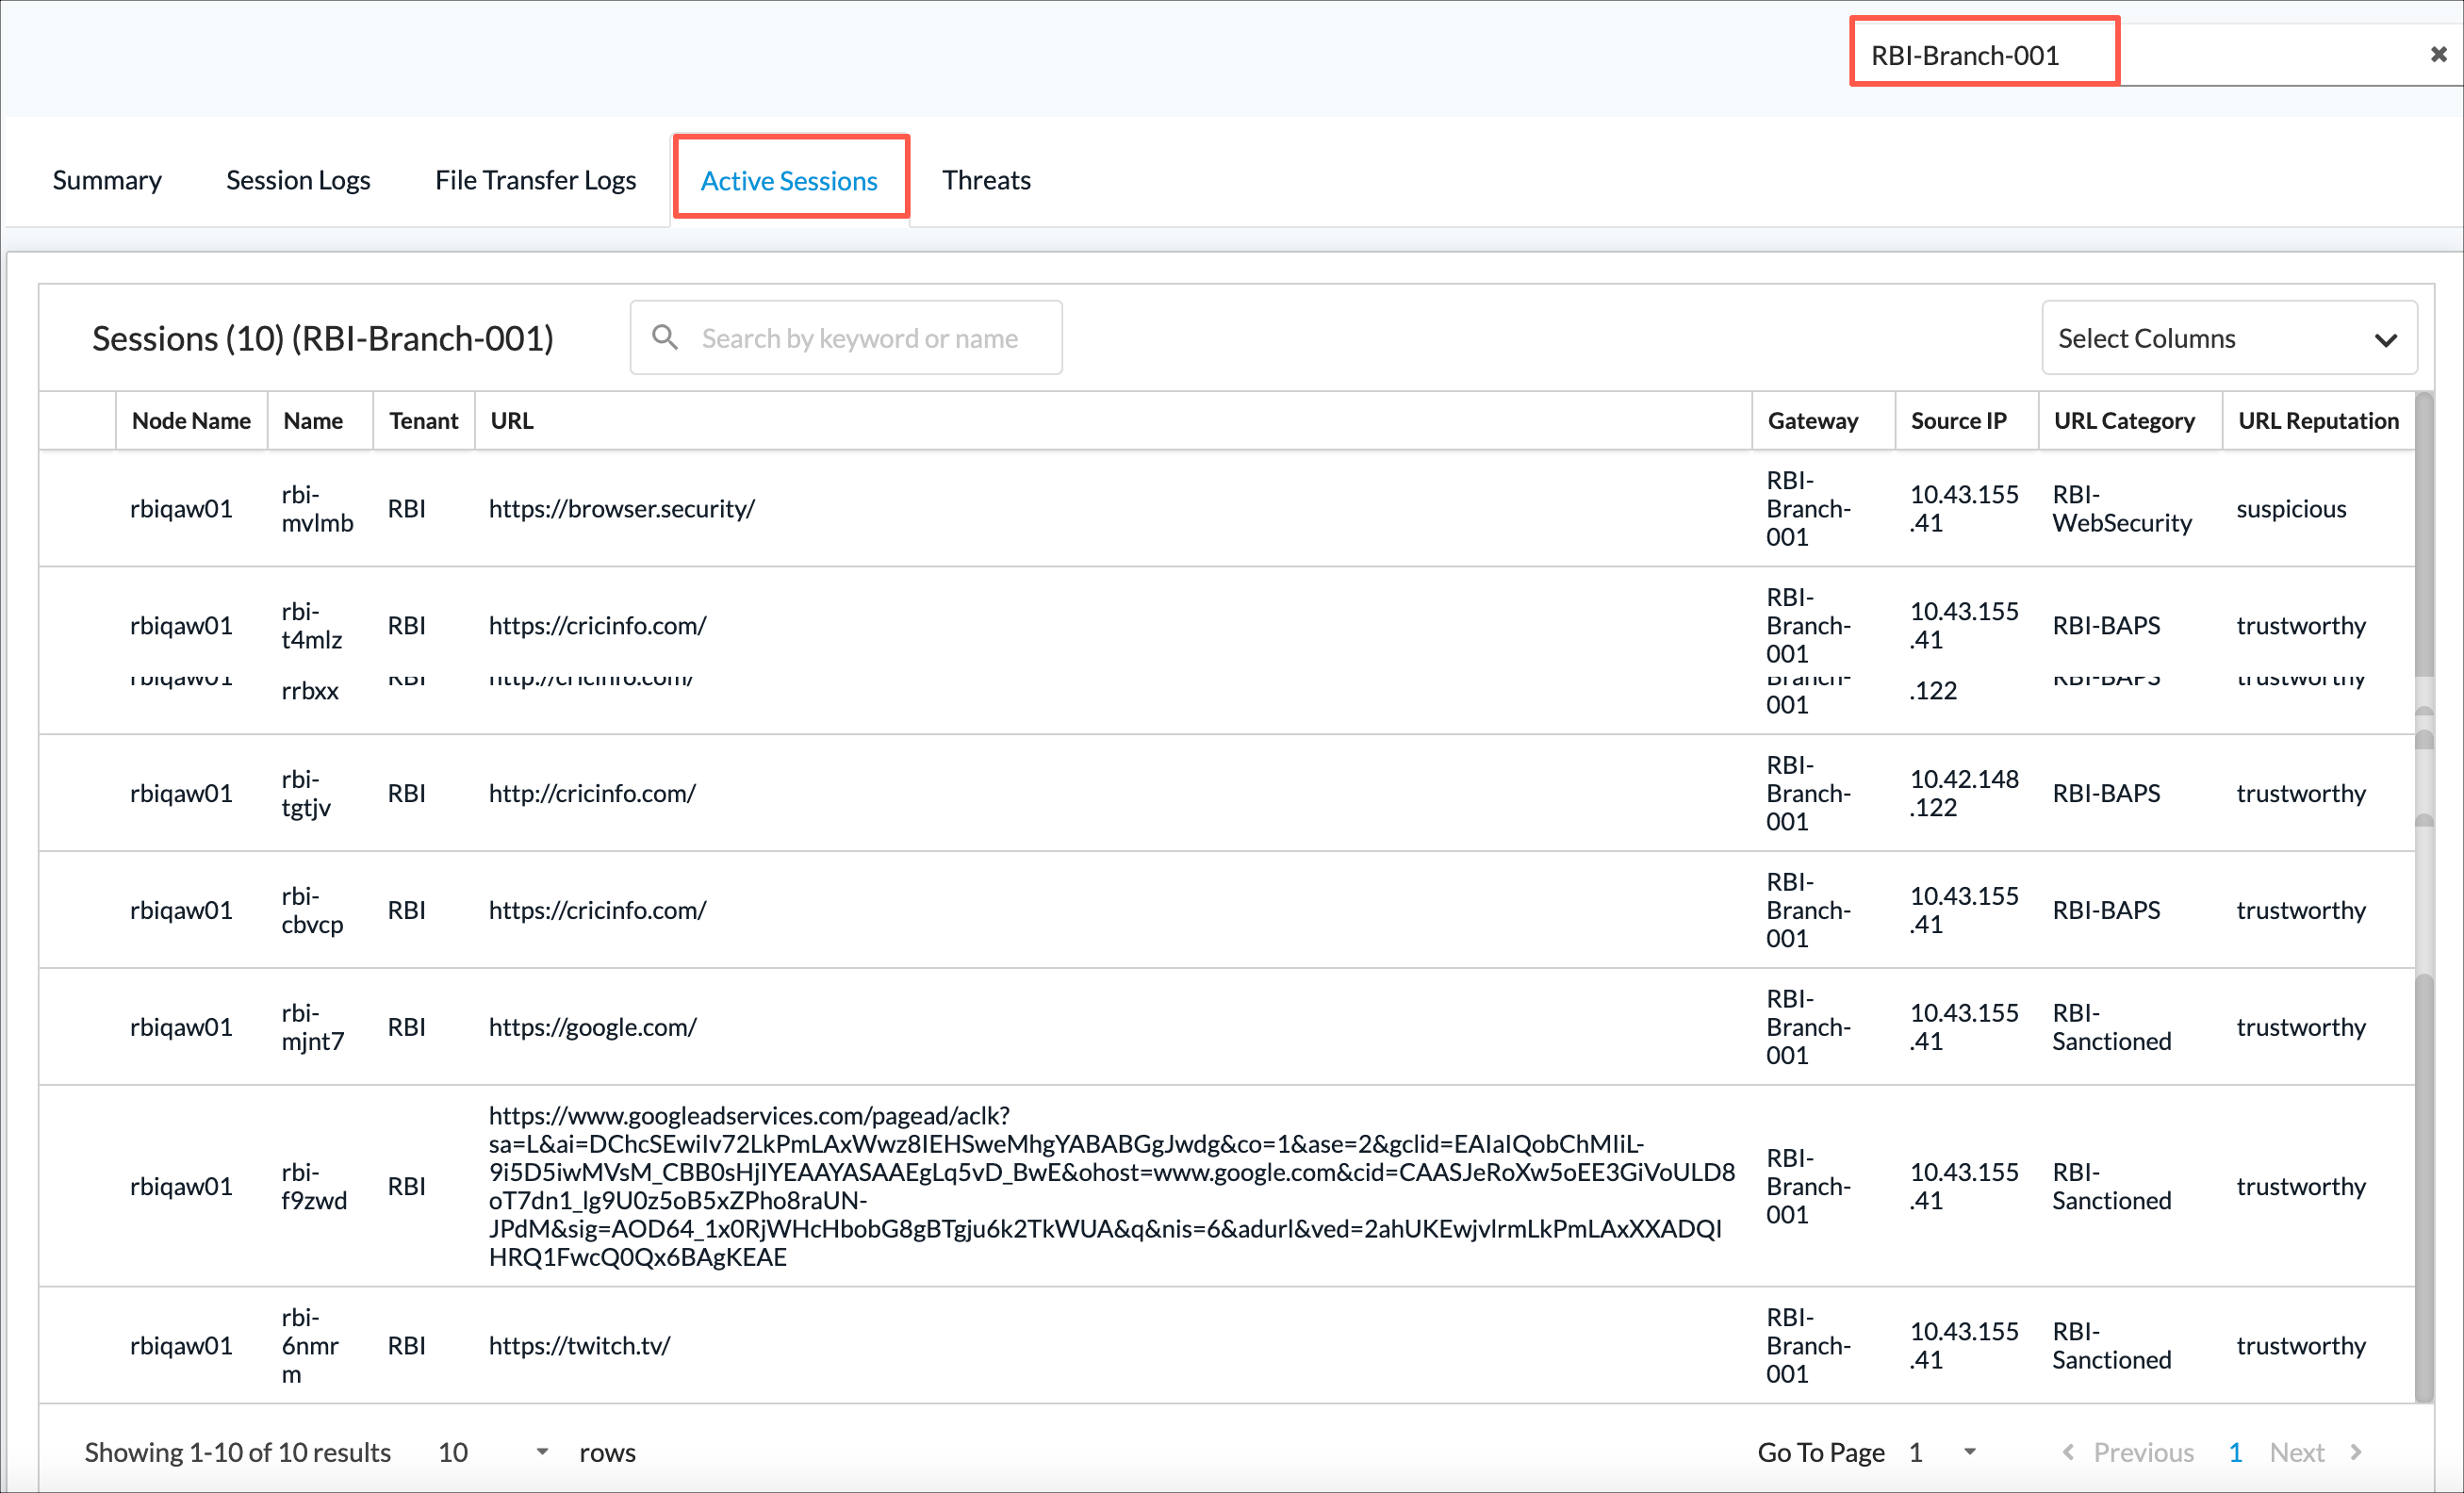
Active Sessions
To view RBI active sessions, select View > Dashboard > Security > Advanced Security> Remote Browser Isolation > Active Sessions, and then select a VOS device from the Appliance drop-down list. The following table displays.
Threats
To display RBI threats, select View > Dashboard > Security > Advanced Security> Remote Browser Isolation > Threats, and then select a VOS device from the Appliance drop-down list.
You can change the screen to display DLP, ATP, or combined DLP and ATP RBI threats by selecting the DLP, ATP, or Overview tab, respectively.
The screen displays the following charts and table:
- Top Applications
- Top Users
- Top Rules
- Top Actions
- Overview

Supported Software Information
Releases 11.3.1 and later support all content described in this article, except:
- Release 11.4.1 adds support for selecting an aggregator node to view analytics that is aggregated from multiple Analytics clusters.
- Release 12.2.1 adds support for generative AI, security alert, risk score, API-DP, email, and RBI dashboards; you can clear alarms for specific devices.
- Release 13.1.1 adds support for User View and Global View for SaaS applications. Global view is supported for IaaS instances. Support is added for showing logs corresponding to rules, source, and destination under Security > Internet Protection > Firewall Overview.