View Analytics Insights
![]() For supported software information, click here.
For supported software information, click here.
Network observability provides insights into the internal state of your network and assists you in detecting and addressing network issues before they escalate. To formulate these insights, Versa Analytics collects telemetry data from network endpoints and analyzes the data in Analytics clusters. You can view the results of the analysis from the Analytics > Insights tab in Versa Director.
You can view insights for the following categories:
- Sites—Sites with local, network, and unknown issues, and links with LTE, WAN utilization, and interface flap Issues.
- Traffic—Unknown TCP, UDP, and SSL traffic and unknown traffic summary. Detection of large uploads and fat flows.
- Application experience—Web traffic and voice/video traffic performance.
Insights are derived from logs in various categories, including traffic monitoring logs. Enabling traffic monitoring logging can generate a high volume of logs and requires an Analytics cluster with enough capacity to store and manage the logs. To prevent disk overload issues, an Analytics cluster should maintain disk storage at approximately 60 percent or less of total disk on search-type and analytics-types Analytics nodes. As an alternative to storing high-volume logs on your local Analytics cluster, you can stream the logs to the Versa advanced logging service (ALS).
Note: For traffic and application experience insights, it is recommended that you export traffic monitoring logs to ALS. The bulk of these logs are of log type flowMonLog. For information about exporting traffic monitoring logs, see Configure SD-WAN Traffic and Web-Monitoring Logging in Apply Log Export Functionality. For information about streaming exported logs to ALS, see Configure the Versa Advanced Logging Service.
This article describes how to enable Analytics insights and how to view Analytics insights information.
Enable Analytics Insights
To enable Analytics insights you do the following:
- Configure a telemetry cache for the Analytics cluster.
- Modify role-based access control (RBAC) roles to enable access to the Insights tab.
Configure the Telemetry Cache
Telemetry data in networking refers to the continuous collection, transmission, and analysis of data from network devices and traffic to gain real-time insights into network performance, health, and security. This data includes metrics, events, logs, and other data, which together provide a comprehensive view of network behavior.
The telemetry cache in an Analytics cluster performs caching and correlation of telemetry data to derive probable root causes for issues in the network. The cache can operate in standalone mode on a single Analytics node, or in high-availability mode on multiple nodes. In high-availability mode, one or more nodes must run a process, referred to as a sentinel, to monitor the health of the telemetry cache and initiate a failover process when required.
To enable the telemetry cache:
- In Director view, select Analytics > Admin > Configurations > Settings.

- In the main pane, select the Telemetry Cache Configuration tab.

- Enter information for the following fields.
Field Description Primary Node Select the primary node for the telemetry cache. Standby Node Select a secondary node to configure HA mode for the telemetry cache or select None for standalone mode.
Sentinel Node For HA mode, select one or more nodes to run a sentinel for the telemetry cache.
- Click Submit.
Configure RBAC Access for Insights
When you log in to your Director UI account and select the Analytics tab, the Director RBAC role for the account is mapped to an Analytics RBAC role with the same name. If the Analytics role has the Insights feature enabled, then the Insights tab displays in the left menu bar when you select the Analytics tab.

If the Insights tab does not display, you can enable it by modifying the Analytics RBAC role.
To enable access to Analytics insights:
- Determine which Director UI account you want to have access to Analytics Insights screens. Both provider and organization accounts can be configured to access these screens.
- Look up the Director RBAC role for the account:
- For provider accounts:
- In Director view, select Administration > Director User Management > Provider > Users
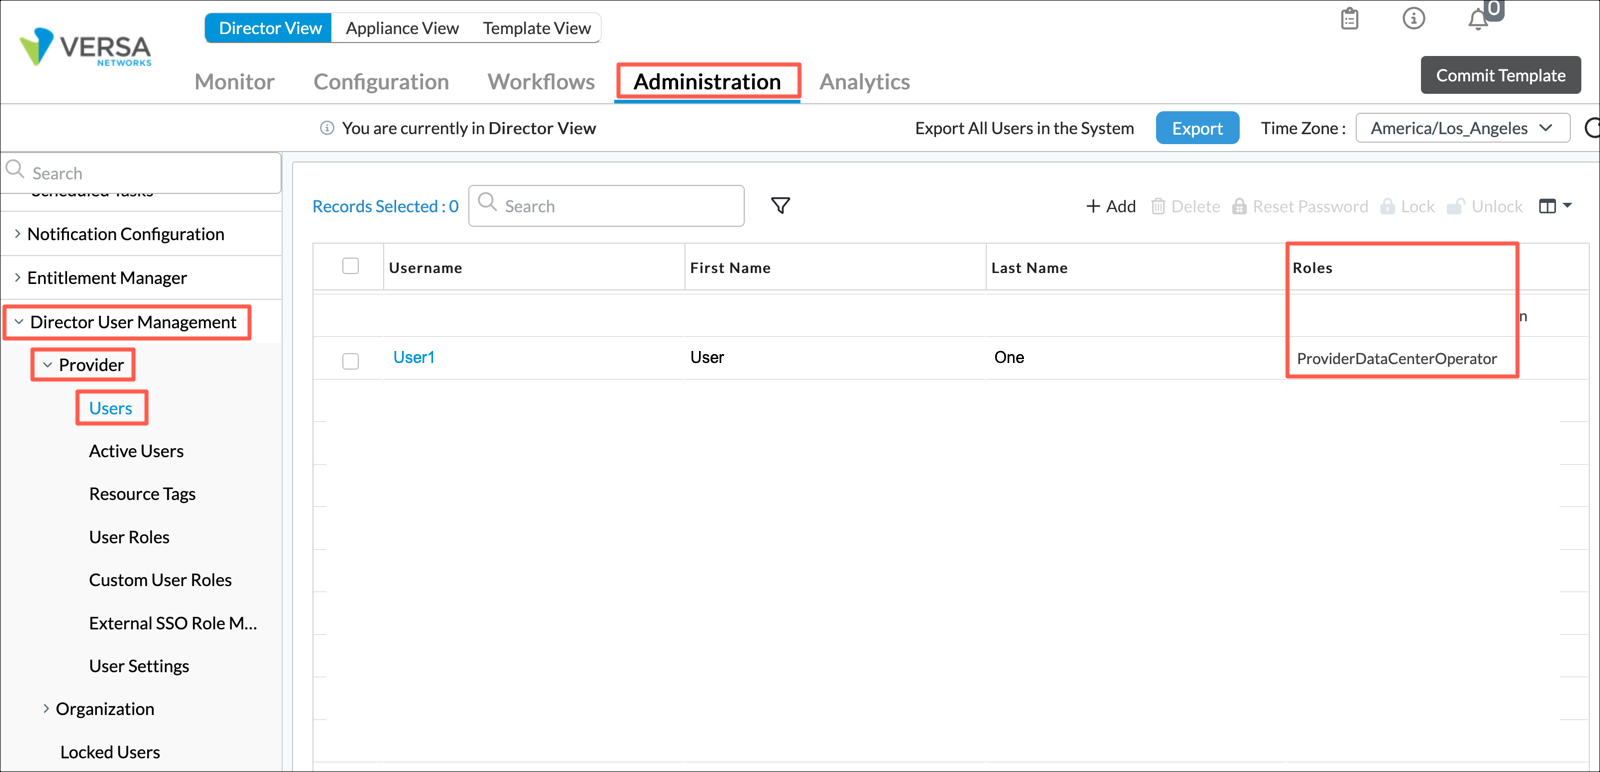
- In the main pane, note the role name for the account. In the example above, the account name is User1 and the role name is ProviderDataCenterOperator.
- In Director view, select Administration > Director User Management > Provider > Users
- For organization accounts:
- In Director view, select Administration > Director User Management > Organization > Users
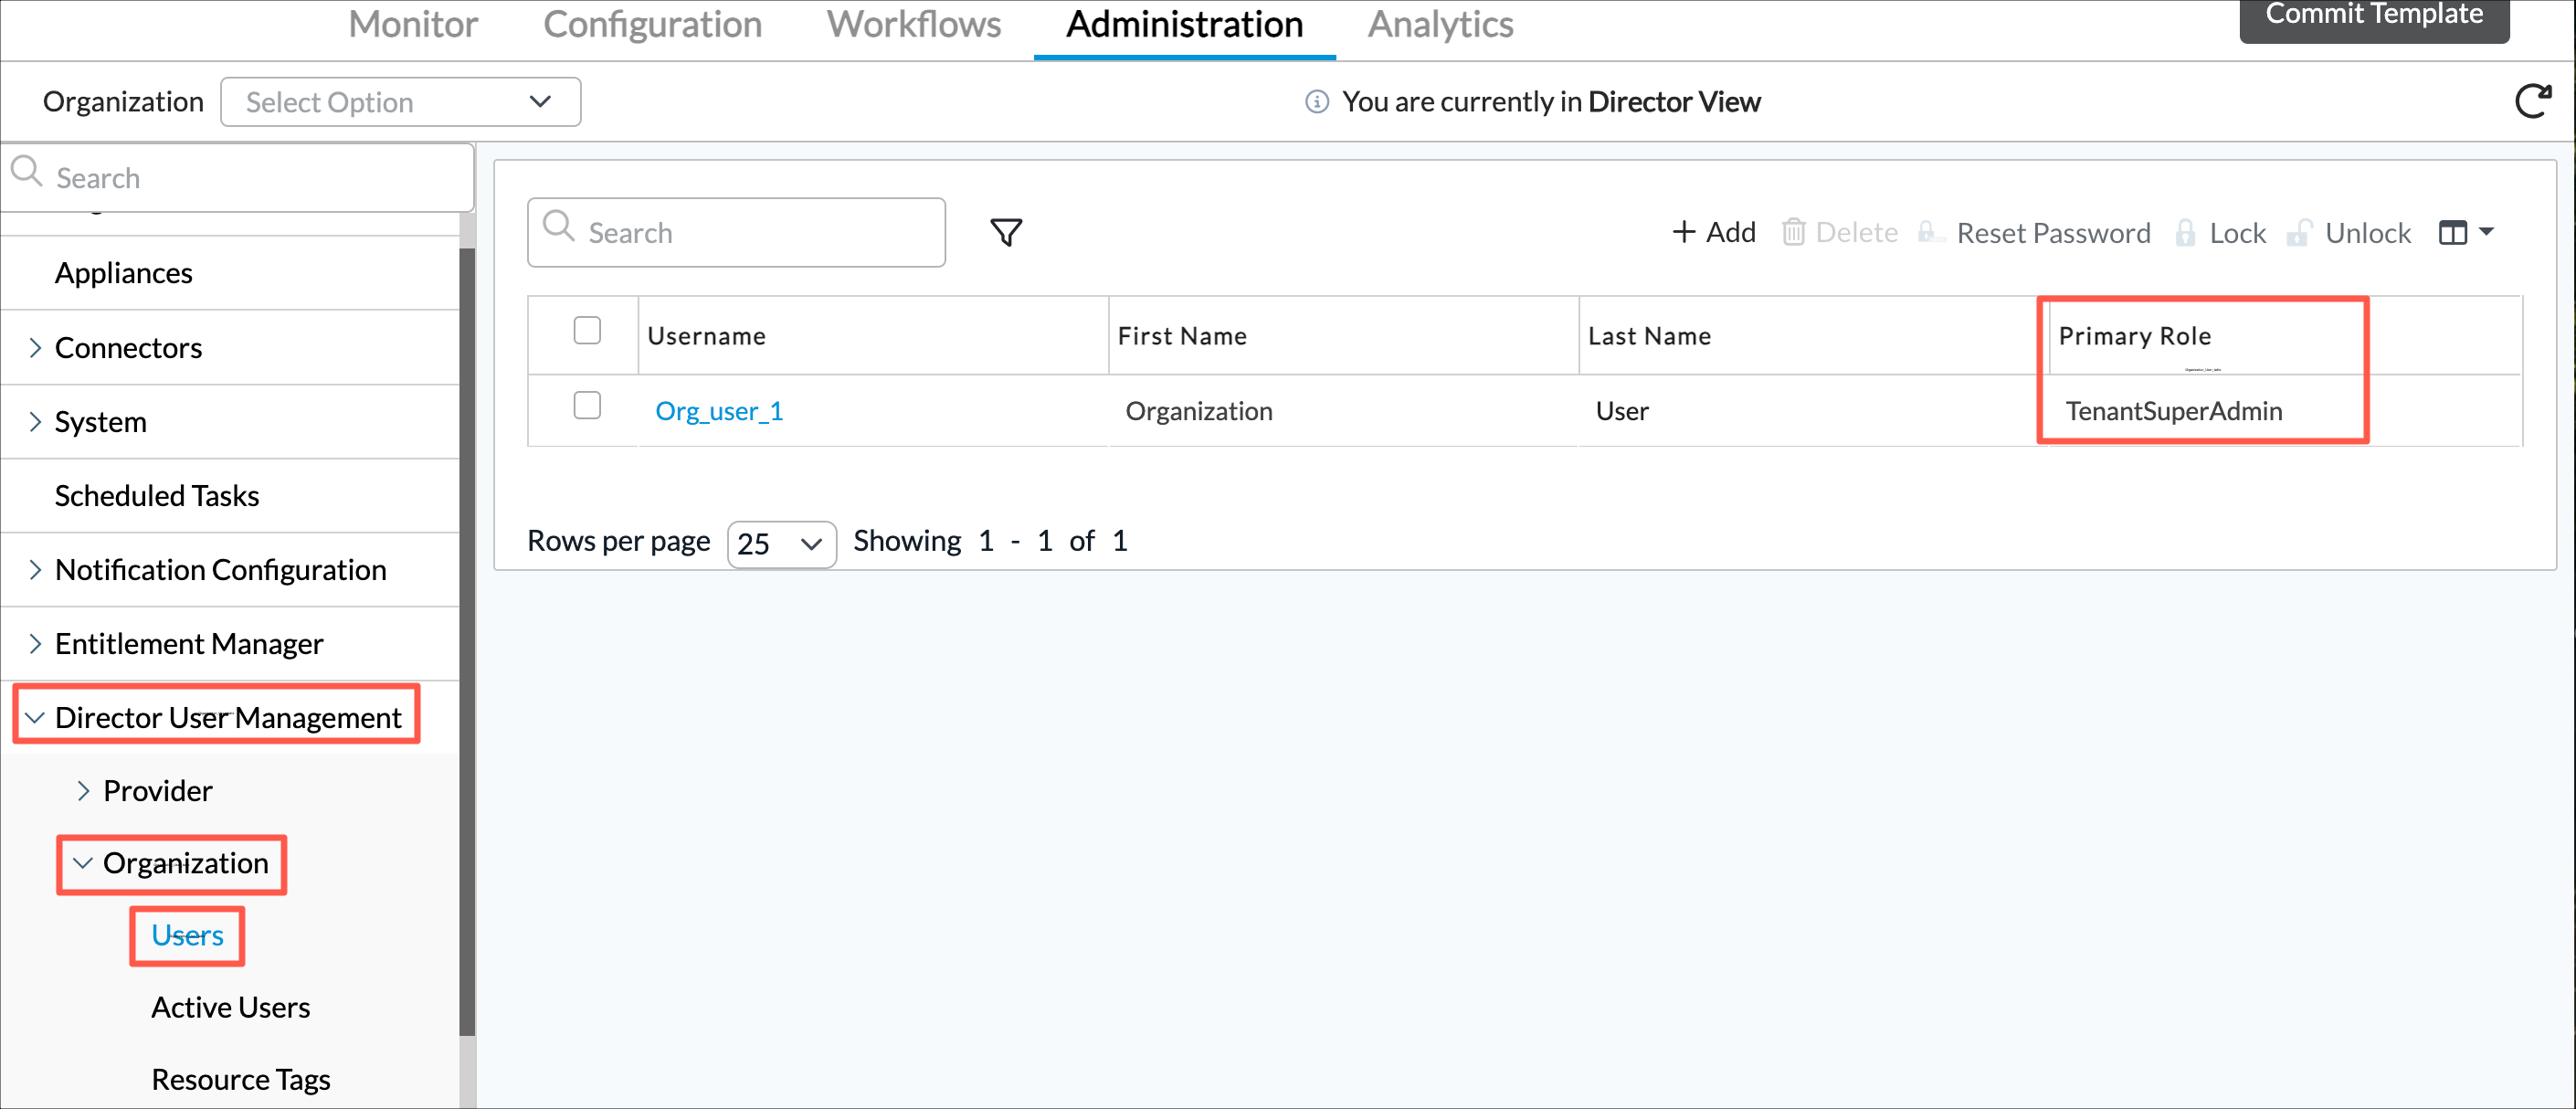
- In the main pane, note the role name for the account. In the example above, the account name is Org_user_1 and the role name is TenantSuperAdmin.
- In Director view, select Administration > Director User Management > Organization > Users
- For provider accounts:
- Locate the Analytics RBAC role with the same name as the Director RBAC role and enable the Insights feature.
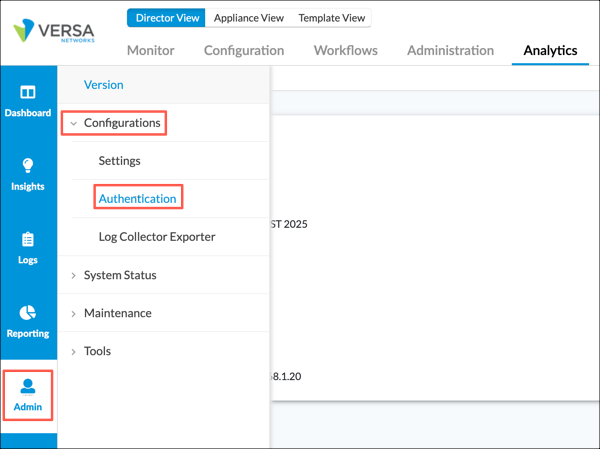
- Select Analytics > Admin > Configurations > Authentication.
- In the main pane, select the Roles Configuration tab.
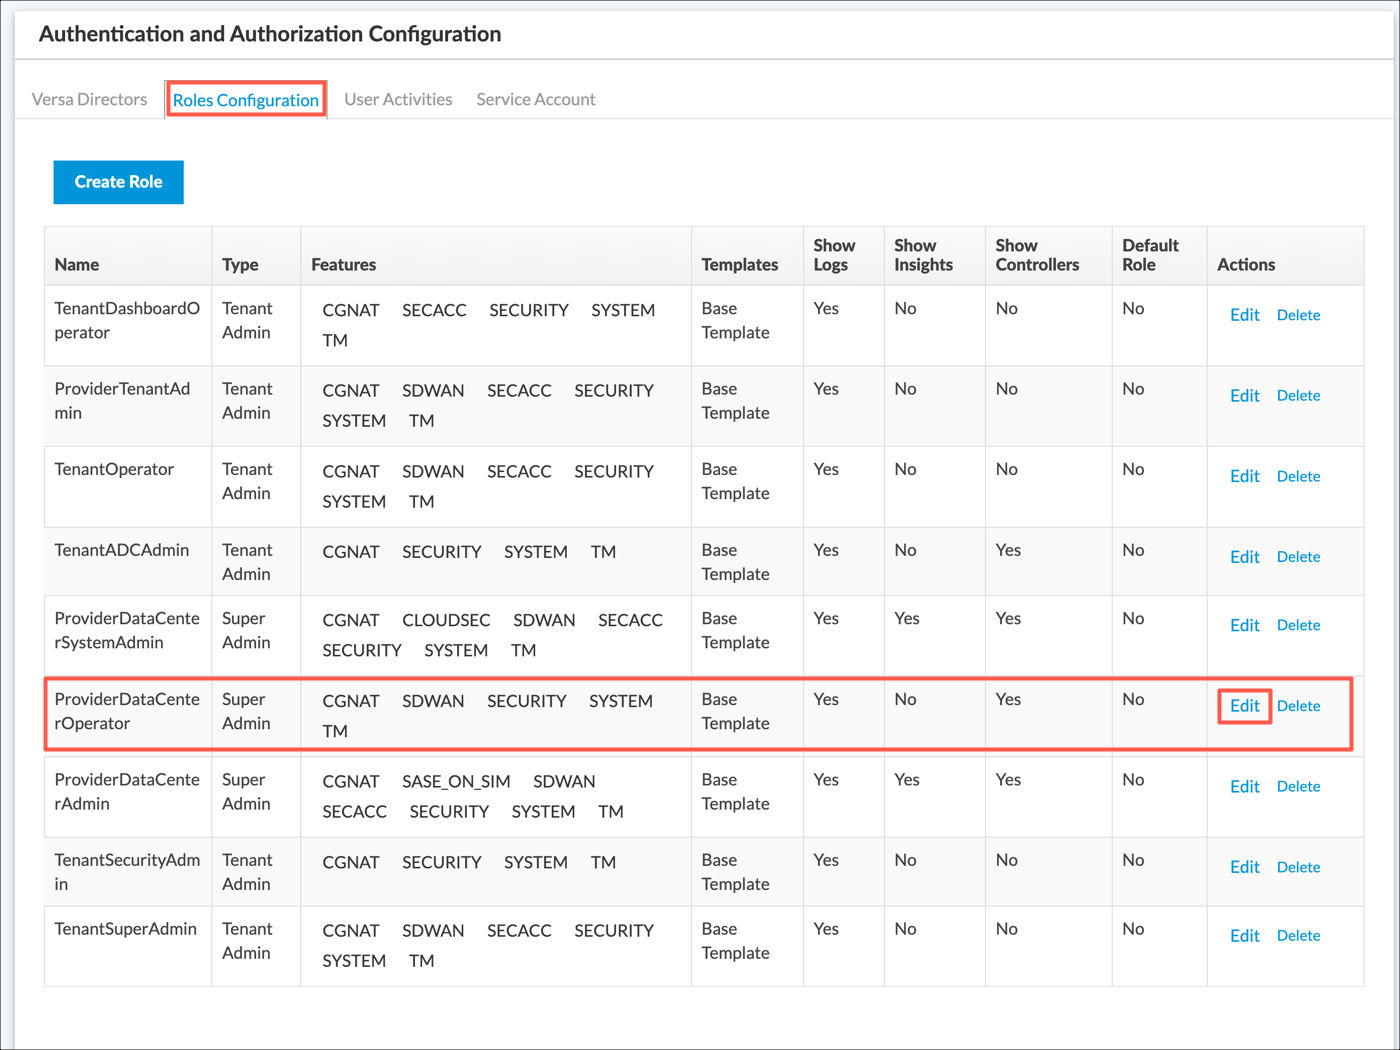
- Select Edit in the Actions column for the RBAC role you noted in Step 2, above. The Create Custom Role popup window displays.

- Select Yes in the Show Insights field.
- Click Save Changes.
- Select Analytics > Admin > Configurations > Authentication.
View Insights
From the Analytics > Insights tab, you can view insights for the following categories:
- Sites and Links
- Traffic
- Application Experience
Sites and Links
Versa Analytics correlates device alarms and logs to assess site and link health and performance.
Sites
Site insights provide probable root cause for device connectivity and restart issues by correlating various alarms and logs from the device. The root cause typically is derived when the site becomes reachable.
To view insights about sites, select Analytics > Insights > Site.

The screen displays the following tabs:
- Sites with Issues—Displays the Sites with Insights table.
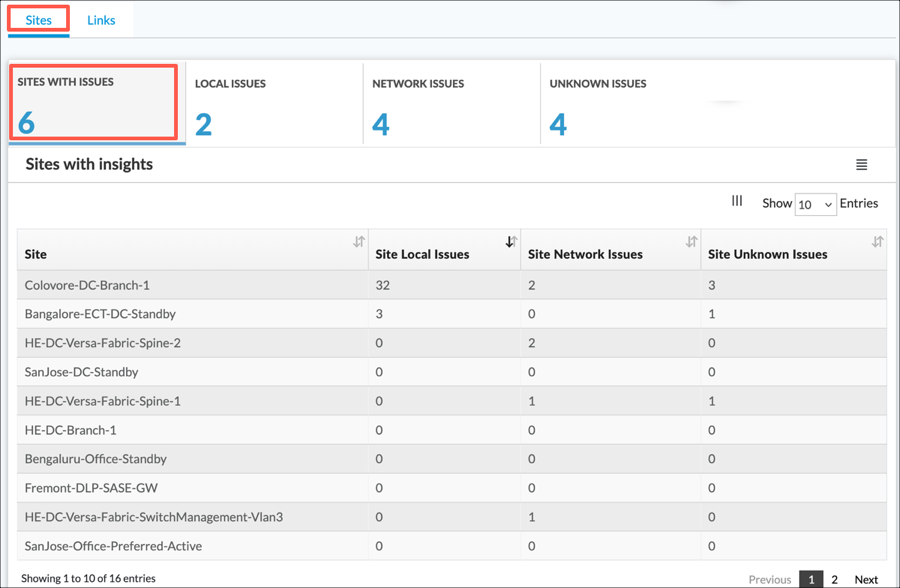
- Local Issues—Displays the following charts and table.
- Top Causes—The Top Causes chart subdivides local issues into the following categories:
- software-crash—Software crashed due to a bug.
- software-restart—Software restarted manually on the device.
- system-reboot—System rebooted due to power issues.
- software-out-of-memory—Software restarted due to running out of memory.
- Local Issues Over Time
- Insights for Sites with Local Issues
- Top Causes—The Top Causes chart subdivides local issues into the following categories:

- Network Issues—Devices that do not have local issues. These are most likely due to network issues.
- Unknown Issues—Devices with issues that are not clearly identifiable.
Links
Link insights reveal WAN link anomalies by analyzing various link-related alarms and logs.
To display insights about links:
- Select Analytics > Insights > Site.
- In the main pane, select the Links tab.

- Select one of the following subtabs to display sites with the issue corresponding to the tab name:
- Sites with Link Issues

- Sites with LTE Issues—Sites with LTE WAN links having poor signal strengths.

- Sites with High WAN Utilization—Sites with WAN link utilization > threshold.

- Sites with High Interface Flaps—Sites with WAN links that periodically flap.

Traffic
Network endpoints export traffic monitoring logs which are streamed through Versa Controllers to an Analytics cluster. Typically, this cluster is part of the Versa Networks advanced logging service (ALS). The logs are analyzed by Versa Analytics to identify network flow patterns and utilization trends. You can view these traffic insights from the Insights Traffic screen at Analytics > Insights > Traffic.

Unknown Traffic
Applications traffic that is labeled as unknown cannot be reliably categorized. You can use unknown traffic insights to determine the reason the traffic is labeled as unknown and to identify whether there are any missing signatures or anomalous traffic patterns.
To view insights about unknown traffic flows, select Analytics > Insights > Traffic > Unknown Traffic.

Select one of the following tabs:
- Summary—Displays a summary of unknown TCP, UDP, and SSL traffic flows between the selected site and other sites.
- Unknown TCP—Unknown TCP flows only.
- Unknown UDP—Unknown UDP flows only.
- Unknown SSL—Unknown SSL flows only.
On all of the above tabs, you can drill down on an entry to display further details.
For example, select Analytics > Insights > Traffic > Unknown Traffic > Summary. The Summary table displays.

Click device SD-WAN-Branch1 in the Site column to view detailed information about unknown traffic for the device. The following tabs display:
- Unidirection TCP Flows
- Short TCP Flows
- Private Destination TCP Flows
- Public Destination TCP Flows

Select any tab, and then click a destination port to view details about traffic for the port.

Click an IP address in the Destination Address column to view traffic monitoring logs for the destination. Traffic monitoring logs are a type of flow log and include fields that identify their flow. For information about flows and flow logs, see Flow Logs.

Click the  Details icon to the left of a log to view logs belonging to the same flow.
Traffic Anomalies
Unusual traffic patterns, such as large uploads and fat flows, are detected using traffic monitoring logs based on factors such as bytes transferred and flow duration. You can view detailed flow logs for traffic that matches these anomalies. This can help to determine whether the destination is legitimate or not.
To view information about traffic anomalies, select Analytics > Insights > Traffic > Anomalies.

Select one of the following tabs:
- Large Uploads
- Fat Flows
Select the Details icon to the left of a row to view related logs.
Application Experience
Application experience insights use APM-enhanced traffic monitoring logs to measure and analyze application user experience.
You can view application experience insights for the following traffic types:
- Web Traffic
- Voice/Video Traffic
Web Traffic Performance
Web traffic performance is categorized based on quality level, as follows:
- Good
- Poor
- Degraded
- Aborted
- Refused
To view web traffic performance insights, select Analytics > Insights > Application Experience > Web Traffic Performance, and then select the tab for a quality level.

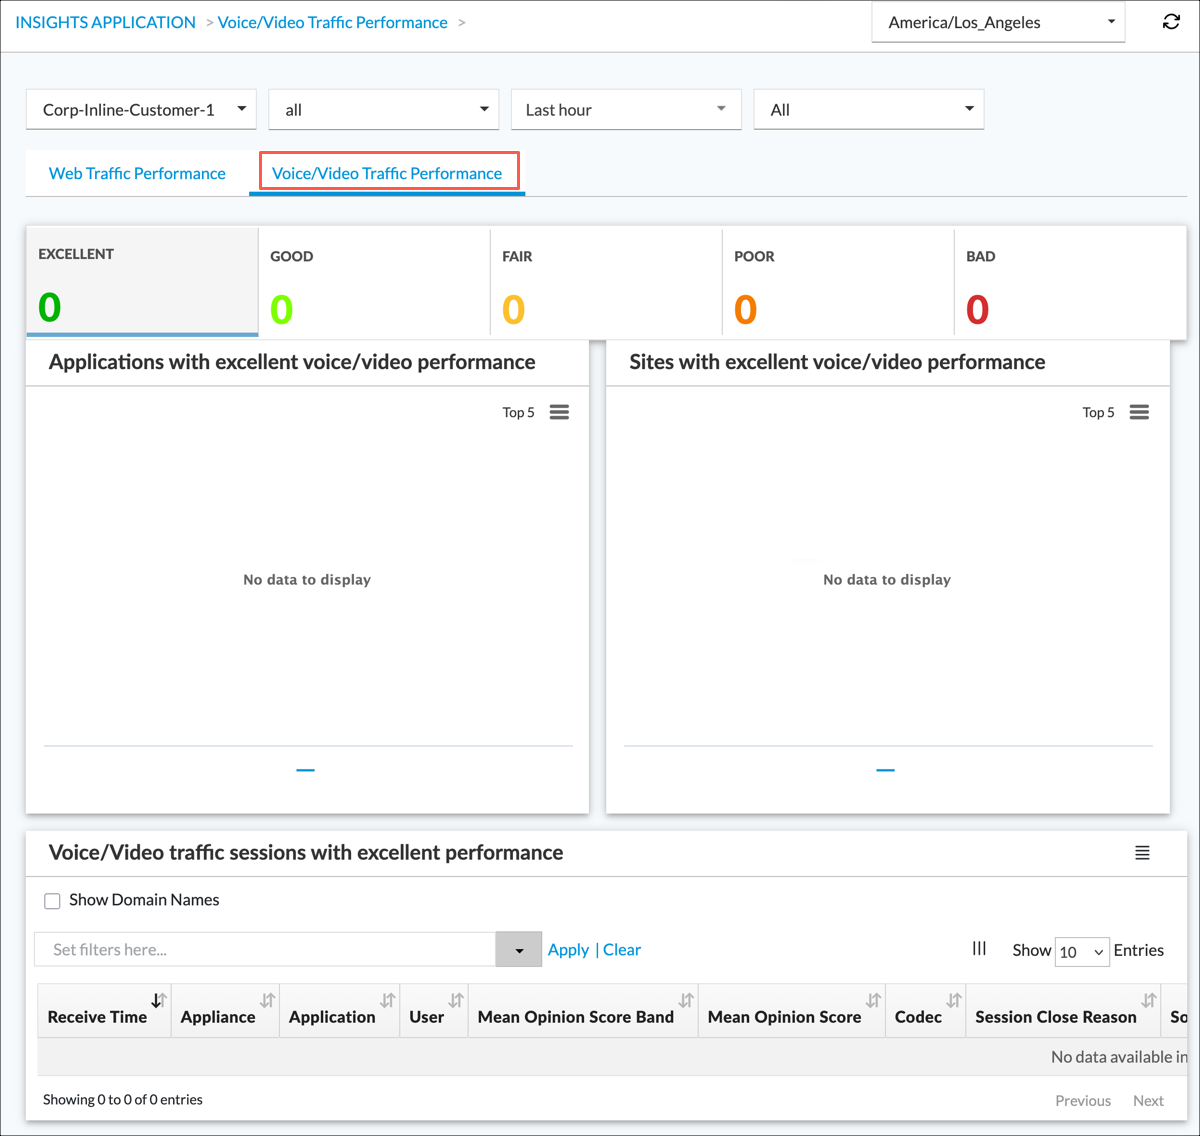
Voice and Video Traffic Performance
Voice and video traffic performance is categorized into the following performance quality levels, based on the mean opinion score (MOS) in related traffic flows:
- Excellent
- Good
- Fair
- Poor
- Bad
To view voice and video traffic performance insights, select Analytics > Insights > Application Experience > Voice/Video Traffic Performance, and then select the tab for a quality level. Information about applications, sites, and sessions with traffic that match the performance quality level display.
Supported Software Information
Release 23.1.1 and later support all content described in this article.