Monitor Provider and Tenant Organizations
![]() For supported software information, click here.
For supported software information, click here.
You can monitor information about provider and tenant organizations in your network from the Monitor tab. For each organization, you can display information about its assets, including devices, software image version, and events and alarms.
Monitor Organizations (Releases 22.1.1 and Later)
To monitor provider and tenant organizations in your network:
- In Director view, select the Monitor tab in the top menu bar.
- For Releases 22.1.1 and later, select an organization from the Organization field. For Releases 21.2 and earlier, select an organization in the left menu bar.
- Select Summary in the horizontal menu bar. The provider organization dashboard displays:

The following sections describe the panes on the organization dashboard:
- Asset Summary
- Recent Events
- Provider Health
- Application Activity
- Firmware Summary
- Services
Asset Summary
The Asset Summary pane displays information about core elements in the organization.

Click a value in the UP, DOWN, or TOTAL columns to display details. In the example above, click the UP value for category SD-WAN Branches to display details for branches in an UP state.
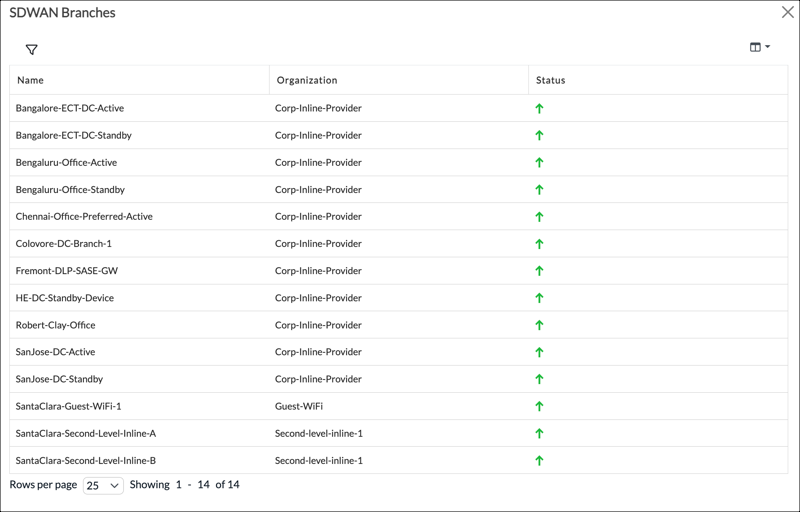
Click X to return to the organization dashboard.
Subtenant Details
In the Asset Summary pane, click Subtenant Details to display information about subtenants.
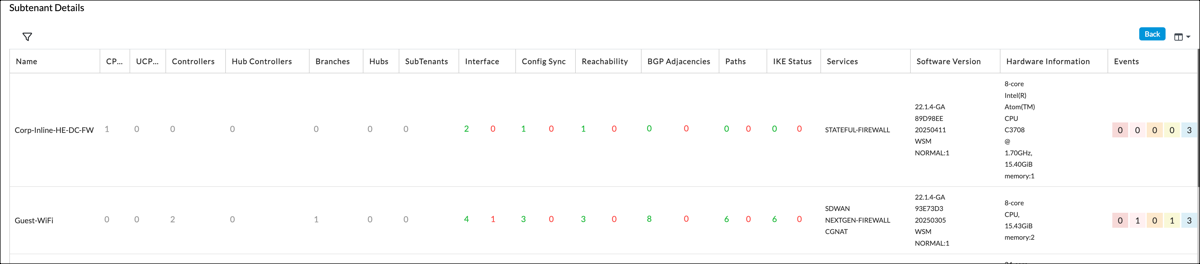
To return to the organization dashboard, click the Back button.
Recent Events Pane
The Recent Events displays a summary of all the alarms across the organization, including alarms for system issues and devices. Alarms are grouped by severity.

To display detailed information about alarms of a specific severity, click the tile for the severity. In the example above, click Critical to display the Recent Events screen:

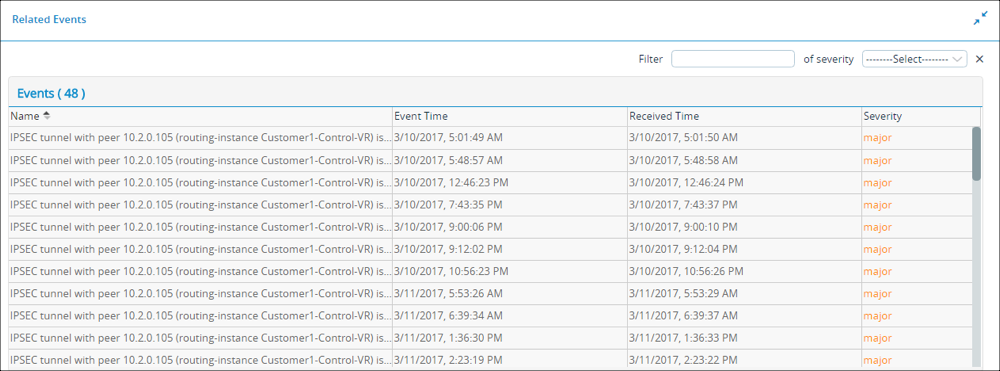
To display detailed information about an alarm, click the device name in the entry for the alarm. In the example above, click the device name in the first table entry to display the Related Events popup window:

Click X to close the Related Events popup window to return to the Recent Events screen.

Click the box in the left column to select an alarm and activate the horizontal menu bar. The menu bar displays the following options.
| Menu Item | Description |
|---|---|
| Back | Click to return to the organization summary dashboard. |
| Clear Selected Alarm | Click to clear the alarm. |
| Export Records | Click to export information about the alarm to your local system. You can select multiple alarms for export. |
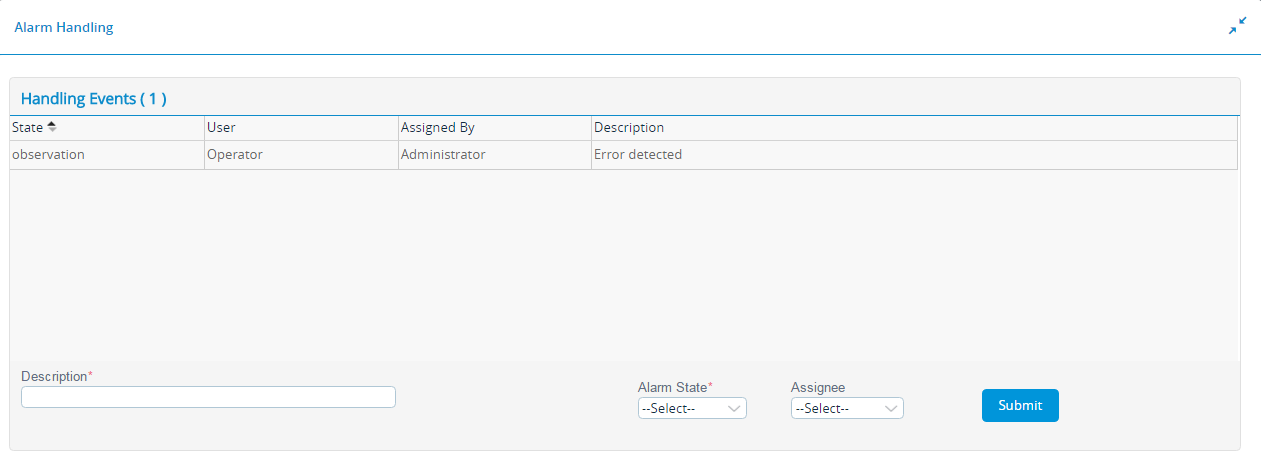
| Handle/Assign |
Click to display the Alarm Handling popup window. The screen displays the tasks assigned by the operator or the administrator.
To assign a task:
|
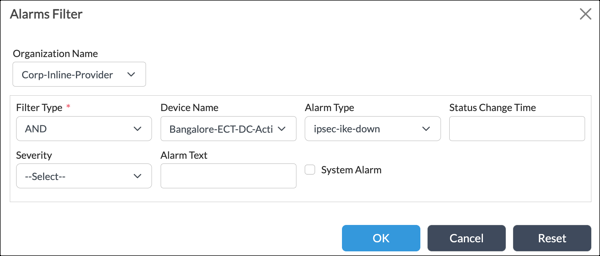
| Alarms Filter |
Click to apply a filter to the Recent Events table. The Alarms Filter popup window displays.
Select values for the filter and then click OK. Click Reset to remove the filter from the Recent Events display. |
| |
Click to select and deselect the columns displayed in the Recent Events table. |
Health Pane
The Heath Pane displays Up, Down, and Disabled status for items in various categories.

The health pane displays the following parameters:
| Health Indicator | Description | Green Color | Red Color |
|---|---|---|---|
| Config Sync Status | Represents whether Versa Director’s device configuration is in sync with the organization's device configuration. | Indicates that the device is in-sync. | Indicates that the device is out-of-sync. |
| Reachability Status | Represents whether the devices are reachable from Versa Director. | Indicates that the devices are pingable. | Indicates that the devices are not pingable. |
| Service Status | Represents whether the services daemons on the devices are running in a good state. | Indicates that the service daemons are running. | Indicates that the service daemons are not running. |
| Interfaces | Represents the interfaces' status up and down count with respect to LAN and WAN interfaces. | Indicates that the interface is up. | Indicates that the interface is down. |
| BGP Adjacencies | Represents the number of BGP adjacencies in the established and idle/connect state. | Indicates that the BGP connection with the neighbor is established. | Indicates that the BGP connection with the neighbor is in an idle or connect state. |
| IKE Status | Represents the number of IKE connections in the up and down state. | Indicates IKE is up. | Indicates IKE is down. |
| Paths | Represents the number of paths with respect to devices associated in the up and down state. | Indicates that the SLA path is up. | Indicates that the SLA path is down. |
Map View
The Map View pane displays a geographic map with VOS device locations. Click a specific device on the map to display detailed information for the device.
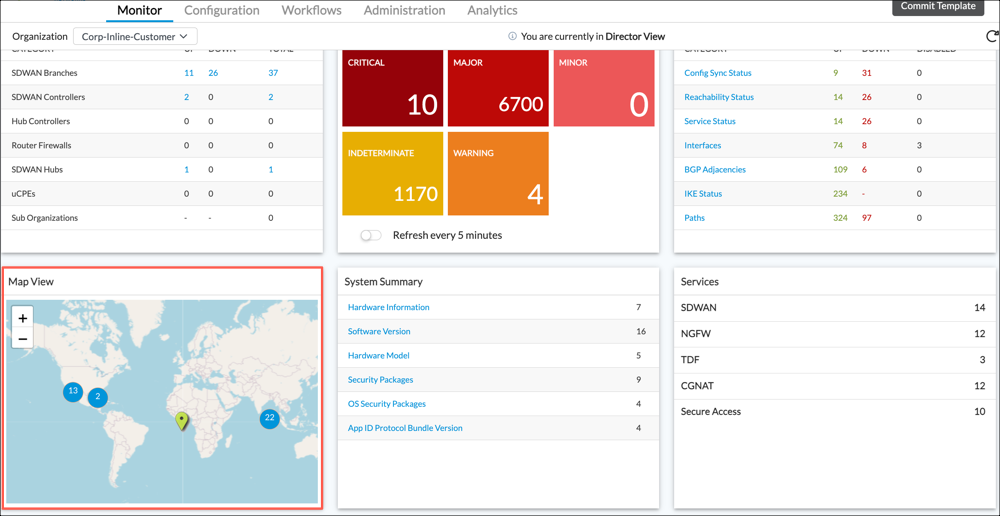
System Summary Pane
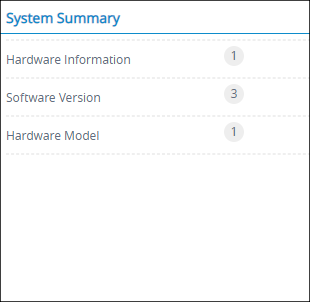
The System Summary pane displays the device summary, along with the hardware and software information.
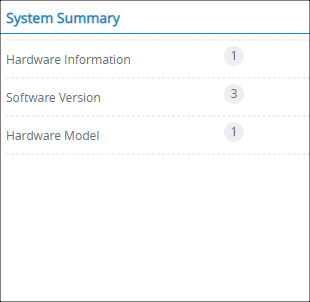
Click a system summary category to display a table of items in the category. For example, clicking Hardware Information displays the following table.
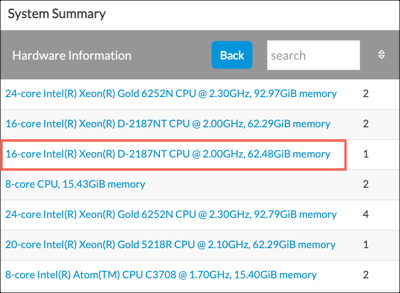
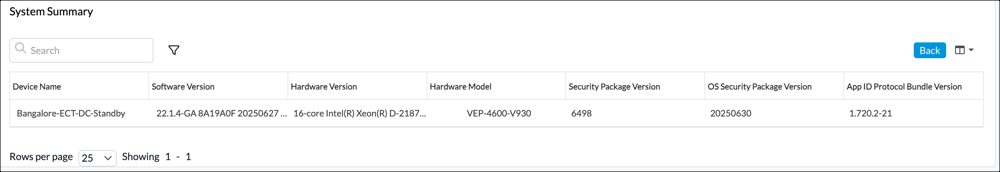
To display detailed information for an item, click its link in the table. For example, clicking the third item in the Hardware Information table, shown above, displays the following information about the selected hardware type:
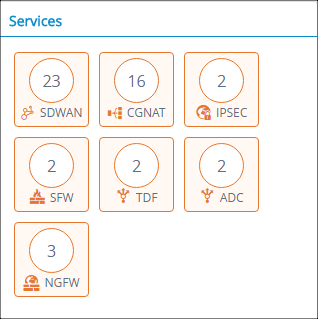
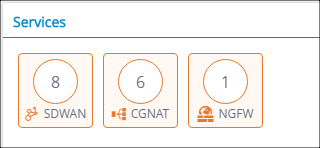
Services Pane
The Services pane displays the total number of services active on devices associated with the selected organization.

Monitor Organizations (Releases 21.2 and Earlier)
Monitor Provider Organizations
To monitor information about provider organizations in your network, you use the links in the left menu bar on the Monitor dashboard. For each organization, you can display information about its assets, including devices, software image version, and events and alarms.
To monitor the provider organizations in your network:
- In Director view, select the Monitor tab in the top menu bar.
- Select the name of a provider in the left menu bar. (In the screenshot here, the provider is called ServiceProvider.)
- Select Summary in the horizontal menu bar. The provider organization dashboard displays:

The following sections describe the panes on the provider organization dashboard:
- Asset Inventory
- Recent Events
- Provider Health
- Application Activity
- Firmware Summary
- Services
Asset Inventory Pane
The Asset Inventory pane displays information about core elements in the provider organization, including:
- Tenants—Number of customer organizations
- Directors—Number of Director nodes in the provider organization's topology. These are the associated active and standby Versa Director. If a single standalone Director node is present, the value shows is 0.
- SD-WAN Controllers—Number of Controllers
- vCPEs—Number of non–SD-WAN nodes, such as normal router, DHCP, NAT, and security standalone devices, that are managed by Versa Director
- uCPEs—Number of universal CPE platforms
- Analytics Cluster—Number of Analytics clusters
- SD-WAN Hubs—Number of hubs
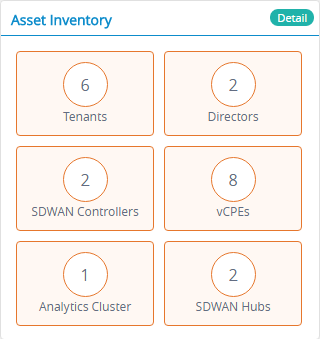
To display information about the assets for each tenant in the organization, click the Details button.

This screen displays the following information for each tenant in the organization:
- Tenant's name
- Number of CPEs
- Number of uCPEs
- Number of Controllers
- Number of branches
- Number of hubs
- Number of customers (subtenants)
- Total number of interfaces, and number of interfaces with alarms (in red)
- Number of devices whose configuration is synchronized and not synchronized (in red) with the Director's configuration
- Number of devices that are reachable or not (in red)
- Number of active BGP sessions (adjacencies), and number that are down (in red)
- Number of paths and paths that are not accessible (in red)
- Number of IKE sessions and IKE session with issues (in red)
- Services configured for the tenant
- Version of software running on the tenant's devices
- Hardware information about the tenant's devices
- Number of events, color-coded by event type
To return to the provider organization dashboard, click the Back button.
Recent Events Pane
The Recent Events displays a summary of all the alarms across the provider organization, including alarms for system issues, customer organizations, and devices. Alarms are grouped by severity.

To display detailed information about a category of alarms, click that alarm type.
To display detailed information about the alarms for individual devices, click the Detail button.
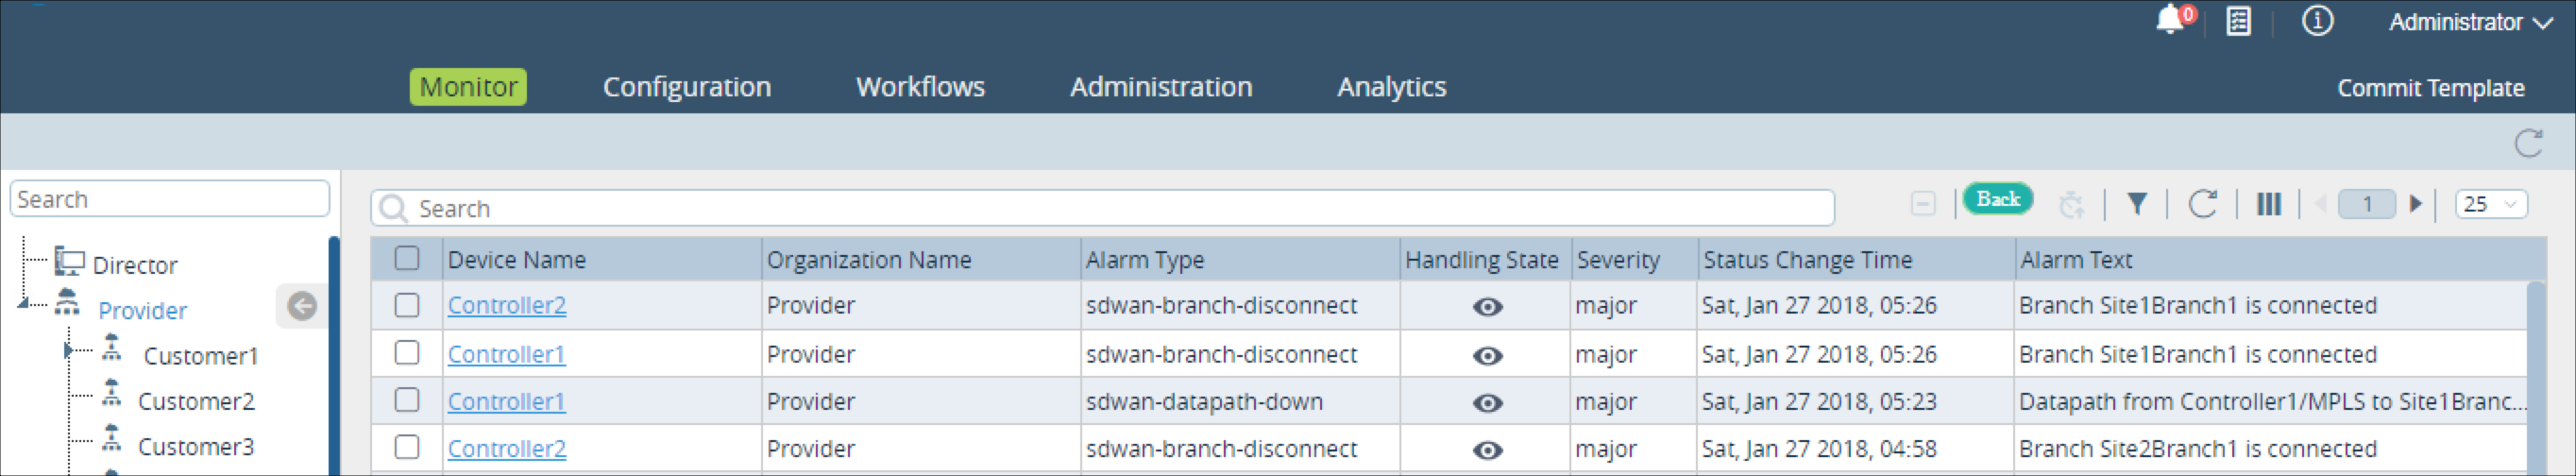
To select the columns to display in the output, click the Column Filter icon.
To return to the provider organization dashboard, click the Back button.
Click the Alarms Filter icon on the top right menu bar to filter the alarms.

Click on a device to view its alarm (raised and cleared) history.

You can filter events per severity level.
Click the Eye icon in the Handling State column of the Events screen to assign tasks. Alternatively, select the check box corresponding to a device record and click the Handle/Assign Handle icon on the top right menu bar to assign tasks.
Provider Health Pane
Go to Monitor > Provider Organization > Provider Health.
This tile displays the summary information of all the devices associated with the child organization or the service provider.
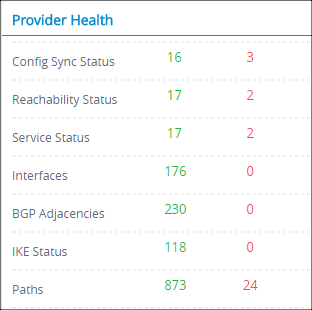
The screen displays the following parameters:
| Health Idicator | Description | Green Color | Red Color |
|---|---|---|---|
| Config Sync Status | Represents whether Versa Director’s device configuration is in sync with the organization's device configuration. | Indicates that the device is in-sync. | Indicates that the device is out-of-sync. |
| Reachability Status | Represents whether the devices are reachable from Versa Director. | Indicates that the devices are pingable. | Indicates that the devices are not pingable. |
| Service Status | Represents whether the services daemons on the devices are running in a good state. | Indicates that the service daemons are running. | Indicates that the service daemons are not running. |
| Interfaces | Represents the interfaces' status up and down count with respect to LAN and WAN interfaces. | Indicates that the interface is up. | Indicates that the interface is down. |
| BGP Adjacencies | Represents the number of BGP adjacencies in the established and idle/connect state. | Indicates that the BGP connection with the neighbor is established. | Indicates that the BGP connection with the neighbor is in an idle or connect state. |
| IKE Status | Represents the number of IKE connections in the up and down state. | Indicates IKE is up. | Indicates IKE is down. |
| Paths | Represents the number of paths with respect to devices associated in the up and down state. | Indicates that the SLA path is up. | Indicates that the SLA path is down. |
Application Activity Pane
Go to Monitor > Provider Organization > Application Activity.
This tile provides a visual representation of the top 10 utilized applications of the devices associated with the service provider.
The selection of the application can be based on the following parameters:
- Sessions
- Transactions
- Total Bytes Forward
- Total Bytes Reverse

To view statistics:
- Click the Settings icon.
- Select a parameter.
The graph displays the break-up for each application. Typically, a Service Provider may not generate significant data traffic. The applications in the above example pie chart represents data traffic with respect to the Service Provider and not its customers.
Firmware Summary Pane
Go to Monitor > Provider Organization > Firmware Summary.
This tile displays the device summary, along with the hardware and software information.
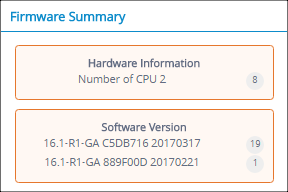
- Hardware Information. The number on the right indicates the number of devices having the listed hardware. In the example screen, there are eight devices with two CPUs each.
- Software Information. The numbers on the right indicate the number of devices installed with the said software version.
Services Pane
Go to Monitor > Provider Organization > Services.
This tile displays the total number of services active on each device with respect to the provider organization or customer organizations associated with that device.
Monitor Tenant Organizations
Each tenant organization monitor dashboard displays the summary and granular information of its associated devices, along with their network health and service information. The information displayed includes the following:
- Tenant organizations connecting to different core elements such as the controllers and different device types associated with the customer organization
- Map displaying the different core elements and device location. Here, you can click on a device on the map to view the device details.
- Firmware summary of the associated devices
- Multiple device health summary with drill down functionality to view the device list with their respective status
- Alarm summary and drill-down functionality to view the list of devices with their respective events
- Application utilization of all the associated devices
- Subscribed services view for each customer organization
- Policy violations view for each customer organization
To display the tenant organization monitor dashboard:
- Select the Monitor tab in the top menu bar.
- Select a provider organization in the left menu bar.
- Select a tenant organization in the left menu bar.

The following sections describe each of the panes on the customer organization monitor dashboard.
Tenant Summary Pane
The Tenant Summary pane display the number of core elements associated and devices associated with the customer organization. Specifically, it displays counts of the following network components:
- SD-WAN Controller nodes associated with the customer organization
- SD-WAN hubs associated with the customer organization
- Branches associated with the customer organization
- Non–SD-WAN nodes, such as routers, DHCP, NAT, and security standalone devices

Click the Tenant Summary pane to view the tenant information in a tabular format.

Click the Back button return to the graphical view.
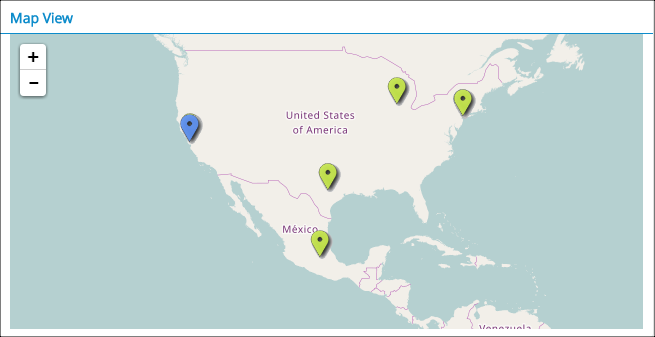
Map View Pane
The Map View pane brings up OpenStreet Maps to display the location of the customer organization. In the map:
- Blue displays the location of Controller nodes.
- Green displays the location of branches.
- Orange displays the location of hubs.
Tenant Health Pane
The Tenant Health pane displays summary information about all the VOS devices associated with the customer organization.
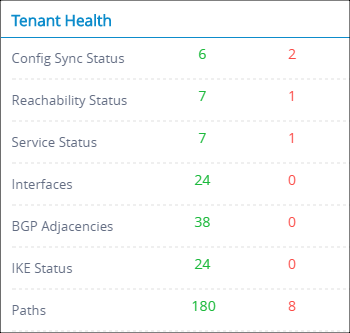
This pane displays the following information:
- Configuration sync status—Number of VOS devices whose configurations are in sync with the Director node’s configuration.
- Reachability status—Number of VOS devices reachable via ping or SSH from the Director node.
- Service status—Number of VOS devices whose services are running in a good state.
- Interfaces—Number of VOS device LAN and WAN interfaces whose status is up and down.
- BGP adjacencies—Number of BGP adjacencies in the established, connect, and idle state.
- IKE status—Number of IKE connections in the up and down state.
- Paths—Number of paths in the up and down state.
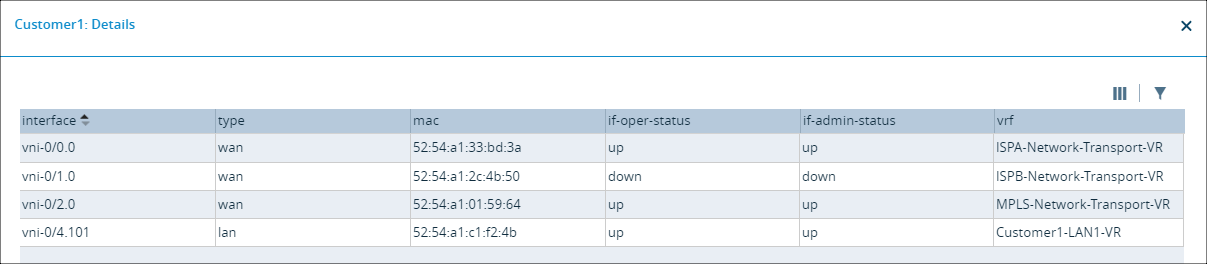
Click on a row to drill down further.
Click the Back icon to navigate to the previous screen. For example, when you click the Interfaces row, the screen shows the status of each interface:
Click Search to search for a device.
Click the Sort icon to sort the data in ascending or descending order.
Recent Events
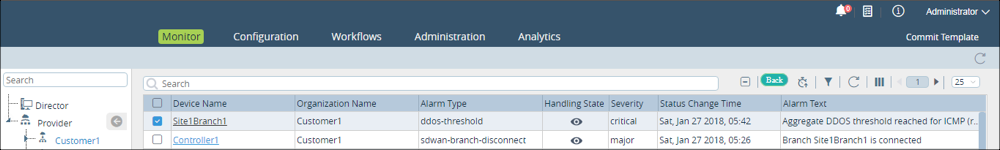
The Recent Events panes displays a summary of all alarms across the customer organizations and their VOS devices by severity—critical, major, minor, indeterminate, and warning. Click an alarms to display the device details for that alarms.
To view the device information for each alarm type in a tabular view, click the Detail button on Recent Events.

To view the history of the alarms raised or cleared, click the VOS device name:
You can filter the events by severity level.
To assign tasks, click the Eye icon in the Handling State column of the Events screen.
The Alarm Handling screen displays:
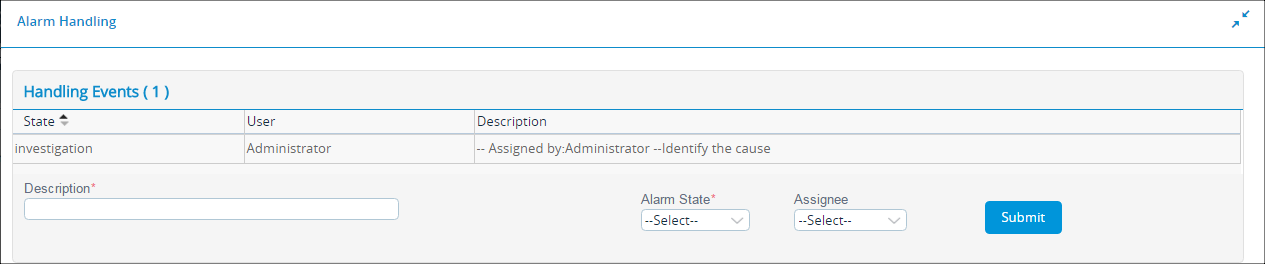
To assign a task:
- In the Description field, enter the event description.
- In the Alarm State field, select an alarm state:
- Acknowledge
- Close
- Investigation
- None
- Observation
- In the Assignee field, select the person to perform the task, either Operator or Administrator.
- Click Submit.
System Summary Pane
The System Summary pane displays a summary of the number of VOS devices and information about their hardware and software version.
Application Activity Pane
The Application Activity panes shows the top 10 utilized applications on the VOSdevice based on the following parameters:
- Sessions
- Transactions
- Total Bytes Forward
- Total Bytes Reverse

To view activity statistics:
- Click Settings.
- Select a parameter. The Application Activity graph displays the breakout for each application.
Services Pane
The Services pane displays a count of the services enabled on each device in the customer organization and its VOS devices.
Supported Software Information
Releases 20.2 and later support all content described in this article, except:
- Releases 22.1.1 and later provides an alternate UI look and feel.