Use Network Monitoring Tools
![]() For supported software information, click here.
For supported software information, click here.
You can monitor the network using the ping, tcpdump, traceroute, and my-traceroute commands, and you can run a speed test.
To access tools to monitor devices in the network:
- In Director view:
- Select the Administration tab in the top menu bar.
- Select Appliances in the left menu bar.

- Select an appliance in the main panel. The view changes to Appliance view.
- Select the Monitor tab in the top menu bar.
- Select an organization in the submenu bar. The following screen displays.

- Select the Tools tab to access the following tools:
- Ping
- Traceroute
- Tcpdump
- Speed Test
- My Traceroute
Ping
Ping is a networking tool that tests the reachability of a device on a network by sending out a special message, called an "ICMP echo request", and measuring the time it takes to receive a response.
- Click Run Ping, and then enter information for the following fields.
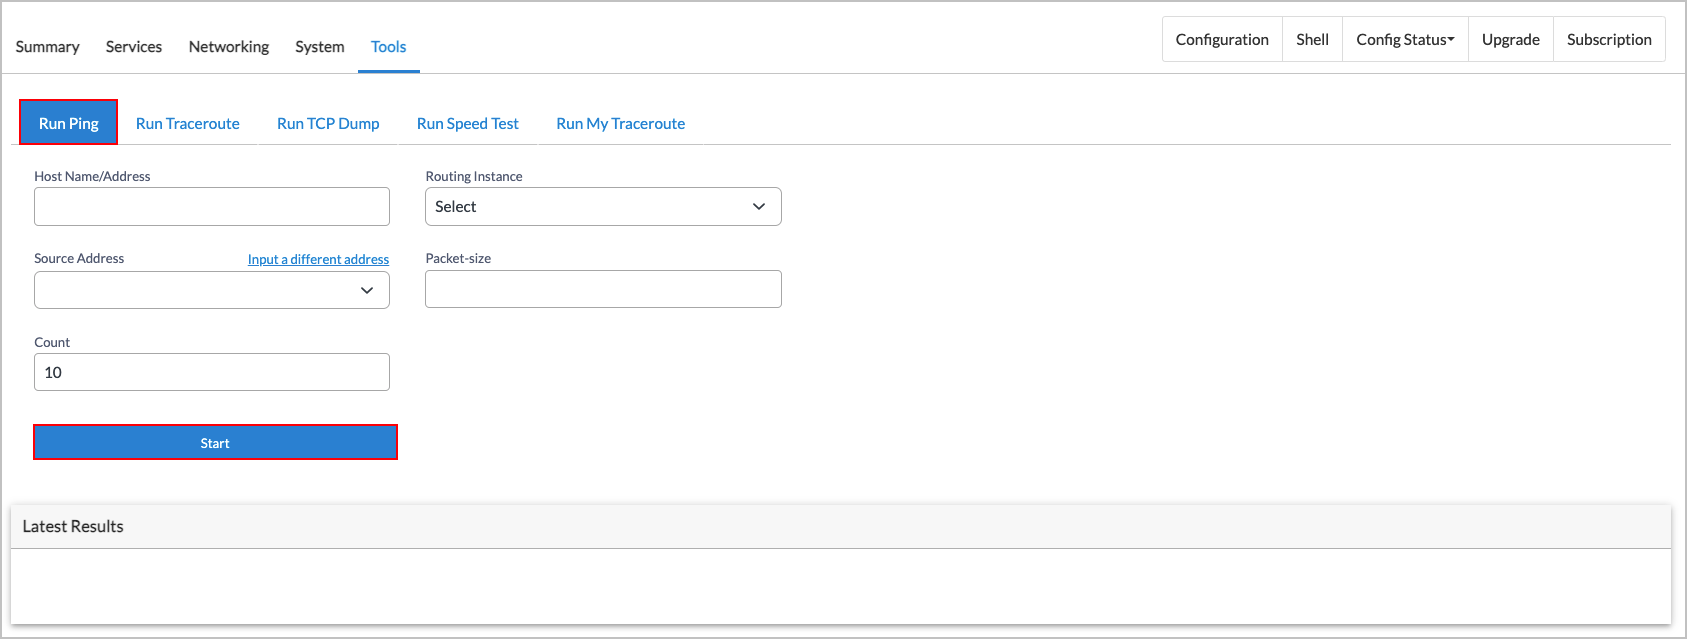
Field Description Host Name/Address Enter the host name or IP address of the host that will receive
the ping packets.
Routing Instance Select a routing instance to use to send the ping packets. Source Address Enter the IP address from which the ping packets are sent. Packet-size Enter the number of data bytes to be sent in the ping requests. Coun Enter the number of packets to send before stopping ping
requests. If you do not specify the count, ping will continue
to send packets until interrupted.
Range: 1 through 10Default: 10
- Click Start. The results display under Latest Results.
Traceroute
Traceroute is a diagnotic tool that maps the path taken from a source device to a destination device. It can help identify the cause of network outages and other issues.
To trace a route:
- Click Run Traceroute, and then enter information for the following fields.

Field Description Target Host Name/Address Enter the host name or IP address of the target host. Routing Instance Select a routing instance to use to send the traceroute. Source IP Enter the IP address from which the traceroute is sent. Protocol Select the protocol to use for the traceroute, either
ICMP ECHO or TCP SYN.
- Click Start. The results display under Latest Results.
Tcpdump
Tcpdump captures and analyzes network traffic. You can use tcpdump to identify network issues and malicious activity. In addition to viewing real-time results, you can save the output to a local file for later analysis. You can specify the number of packets for tcpdump to capture. To do this, configure the Number of Packets option. After tcpdump captures the configured number of packets, it terminates. If you do not specify the number of packets to capture, tcpdump runs indefinitely.
When tcpdump runs on a vni port, it captures all packets on the port. On enet ports, tcpdump captures only packets that are going to the CPU, by default. To configure tcpdump to capture all packets on an enet port, enable the NPU option. This option has the following settings:
- NPU not enabled (default). Captures only packets that are going to the CPU.
- NPU enabled: Captures all packets on the port, including packets from the NPU.
The NPU option is not applicable for vni ports.
Note: When you run tcpdump on a CSX device, you can only enable NPU on one enet port. The simultaneous capture of packets on multiple ports with NPU enabled is not supported.
To run tcpdump on an interface:
- Click Run TCP Dump, and then enter information for the following fields.
For enet ports:

For vni ports:
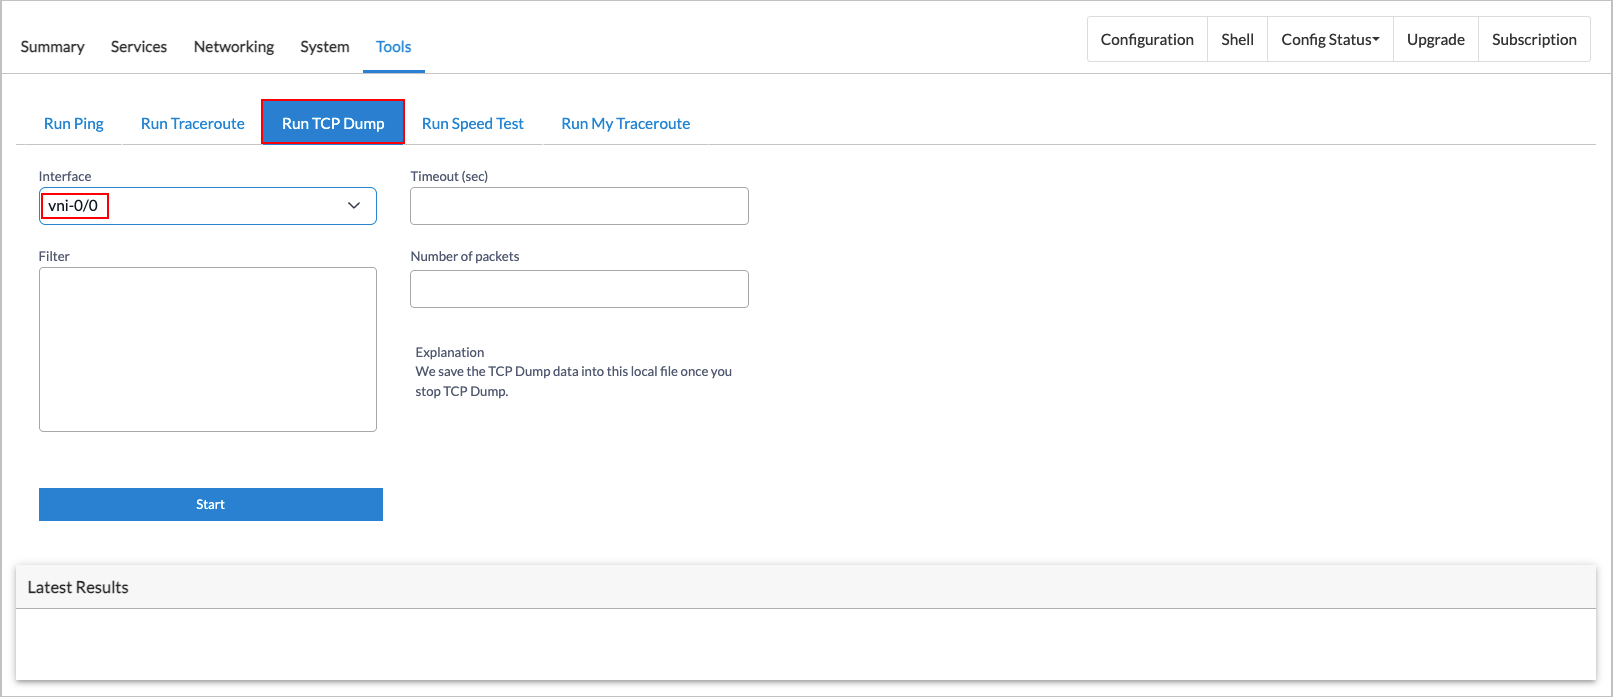
Field Description Interface Select the interface for tcpdump to use to capture and analyze the network traffic.
Timeout (sec) Enter the amount of time, in seconds, before the tcpdump times out.
Default: 60 seconds
Filter Enter the type of filter to apply to packets on an interface using the standard tcpdump command syntax. For more information, see Usage Examples, below. Number of Packets Enter the number of packets to capture before tcpdump terminates. NPU (For Release 22.1.4 and later.) For enet ports only, click the checkbox to allow tcpdump to capture packets from the NPU.
- Click Start. The following screen displays.

- You can click the Stop button to end tcpdump, or you can wait until the tcpdump finishes.
- Once tcpdump finishes, the following screen displays.

- You can click Download to download a file with the tcpdump output to your local system.
Usage Examples
The following table shows examples of how to use tcpdump filters to match different types of packets on enet or vni interfaces. For each packet type that you want to match, enter the filter information in the Filter box of the Tools > Run TCP Dump screen.
The following example screenshot shows how to run tcpdump with the icmp filter for interface vni-0/0:

| Type of Packets to Match | Filter |
|---|---|
| Capture all the traffic on an interface (should be avoided in high throughput cases). | (No filter) |
| Capture all ICMP traffic. | icmp |
| Capture all ARP traffic. | arp |
| Capture traffic for a specific host in both directions (RX/TX). | host 8.8.8.8 |
| Capture traffic for a specific port in both directions. | port 4790 |
| Capture traffic for a specific host with a IP packet length greater than 180. | host 10.10.10.10 and greater 180 |
| Capture traffic for a specific host with packet sizes in a certain range. | host 10.10.10.10 and greater 1000 and less 1200 |
| Capture traffic for a specific host and a port in both directions (RX/TX). | port 4790 and host 10.10.10.10 |
| Capture traffic for certain time intervals and then stop. | timeout 5 |
| Capture traffic for port 67 or 68 in both directions on an interface and display the output as verbose. | port 67 or 68 -v |
| Capture traffic from a specific subnet. | net 10.10.10.0/24 |
| Capture traffic for port 80 or 8080 in both directions on an interface and save the packet captures (pcaps) to a file. | port 80 or 8080 -w httpfile.pcap |
| Capture traffic from a specific MAC address. | ether host xx:xx:xx:xx:xx:xx -v |
| Capture traffic from a specific Ethernet protocol. This example is for the protocol LLDP. | ether proto 0x88cc -vvx |
Speed Test
You can run a speed test using a Versa Operating System™ (VOS™) device as a speed-test server, or by using an internet speed-test server.
If you use a VOS device as a speed-test server, you can then initiate the speed test from a local VOS device to test the link between the VOS device and the VOS speed-test server. For information about setting up a VOS device to be a speed-test server, see Troubleshoot Link Bandwidth Issues.
Note: Before you can run a speed test using a VOS device as the speed-test server, you must configure the VOS device to be a speed-test server. See Troubleshoot Link Bandwidth Issues for more information.
If you use an internet speed-test server, you run the speed test from a VOS device to a predeployed internet speed-test server. For information, see Run Internet Speed Tests.
To run a speed test using a VOS device as a speed-test server:
- Click Speed Test, and then enter information for the following fields.

Field Description Remote IP Address/FQDN Enter the IP address or fully qualified domain name of the
remote device.
Network Select a network to use for the speed test from the
drop-down list.
- Click Test Speed.
To run a speed test using an internet speed-test server:
- Click Speed Test, and then click the Internet tab. The following screen displays.

- In the Routing Instance field, select the routing instance to use to run the speed test.
- To run the speed test using the default internet speed-test server, click Test Speed.
- To select a specific internet server to use for the speed test:
- Click Advanced Settings. The following screen displays.

- Select the routing instance to use for the speed test.
- Click Fetch Server List. The screen displays a list of speed-test servers and their Server ID numbers.
- Choose one of the servers, and then enter the server's ID number in the Server ID field.
- Click Test Speed to initiate the speed test using the specified internet speed-test server.
- Click Advanced Settings. The following screen displays.
My Traceroute
My Traceroute combines the functionality of the traceroute and ping programs in a single network diagnostic tool.
To run my traceroute:
- Click Run My Traceroute. The following screen displays

- Enter information for the following fields.
Field Description Target Host Name/Address Enter the host name or IP address of the target host. Routing Instance Select a routing instance to use to send the traceroute. Source IP Select the IP address from which the traceroute is sent. Protocol Select the protocol to use for the traceroute, either
TCP SYN or UDP.
Cycle Count Enter the number of pings sent to determine both the
machines on the network and the reliability of those machines.
Each cycle lasts one second.
- Click Start. The results display under Latest Results.
Supported Software Information
Releases 20.2 and later support all content described in this article, except:
- Release 22.1.4 and later support allowing Ethernet ports to read packets from the NPU.
Additional Information
Configure NPU Policy-Based Forwarding
Run Internet Speed Tests
Troubleshoot Link Bandwidth Issues