Configure IP SLA Monitor Objects
![]() For supported software information, click here.
For supported software information, click here.
IP SLA monitoring is a method of actively and continuously monitoring traffic across the network and reporting about the traffic. You can monitor an IP address or a fully qualified domain name (FQDN) by configuring an IP SLA monitor object and then associating the object with the IP address or FQDN. To verify whether the IP address or FQDN is up or down, the IP SLA monitor sends either DNS, HTTP and raw HTTP, ICMP or TCP probe packets.
In a monitor object, you can specify either a single IP address or FQDN or a group of addresses of FQDNs. If you use FQDNs, you must also specify the system DNS server to use for the name resolution.
You can configure IP-SLA damping to stabilize the network paths by suppressing IP-SLA monitors that frequently alternate between up and down states. This behavior, known as flapping, generates excessive network churn, causing unnecessary loads on devices, delaying convergence in the network, and possibly creating data black holes.
To configure IP-SLA damping, you assign a penalty value to the monitor object that increases each time the monitor flaps (for example, 1000 per flap). If the penalty exceeds a predefined suppression threshold, the monitor is marked as dampened and a down notification is sent to applications that are using this monitor. As long as the monitor is suppressed, changes to its state are ignored until the monitor is unsuppressed.
Penalties decrease over time based on a half-life interval, allowing suppressed monitors to recover if they remain stable. You can configure a reuse threshold, which is the value that the penalty must reach for the monitor to be unsuppressed. When the monitor is unsuppressed, relevant state notifications are sent to registered applications.
Configure an IP SLA Monitor Object
To configure an IP-SLA monitor object:
- In Director view:
- Select the Administration tab in the top menu bar.
- Select Appliances in the left menu bar.
- Select a device name in the main panel. The view changes to Appliance view.
- Select the Configuration tab in the top menu bar.
- Select Networking > IP SLA > Monitor in the left menu bar. The main pane displays the IP SLA monitor objects that are already configured.

- Click the
 Add icon. In the Add IP SLA Monitor popup window, select the General tab and enter information for the following fields.

Field Description Name (Required) Enter a name for the IP SLA monitor object. Interval Click, and enter the frequency, in seconds, at which to send ICMP packets to the IP address.
Range: 1 through 60 seconds
Default: 3 seconds
Interval Milliseconds Click and enter the frequency, in milliseconds, at which to send ICMP packets to the IP address.
Range: 100 through 60000 milliseconds
Default: 3000 milliseconds
Threshold Enter the maximum number of ICMP packets to send to the IP address. If the IP address does not respond after this number of packets, the monitor object, and hence the IP address, is marked as down.
Range: 1 through 60
Default: 5
Monitor Type (Required) Select the type of packets to send to the IP address:
- DNS
- (For Releases 22.1.1 and later.) HTTP
- (For Releases 22.1.1 and later.) HTTP Raw
- ICMP
- TCP
Domain Name (Required) For DNS monitors and if you configure an FQDN, enter the domain name for the IP SLA monitor. Destination Port (Required) For DNS, HTTP, raw HTTP, and TCP monitor types, enter the destination port for the IP SLA monitor. Forwarding Class Select a forwarding class for the IP SLA monitor to override the default forwarding class. Nexthop Select the device to use as the next hop. Monitor Subtype Select the monitor subtype:
- HA probe type—Select to avoid interchassis HA split brain. For more information, see Configure Stateful Interchassis HA.
- Layer 2 loopback type—Select to monitor an external service node configured as a Layer 2 loopback (virtual wire).
- No subtype—Do not use a monitor subtype. This is the default.
Default: No subtype
Organization Select an organization for the IP-SLA monitor. Enforce Egress (For Releases 23.1.1 and later.) Select this option to send monitor probes through a given egress interface. Select one of the following:
- Source Interface—This enforces monitor probes to exit from the interface configured as source-interface in the monitor configuration.
- Source Network—This enforces monitor probes to exit from the interface that is part of the network in monitor configuration. Source is used derive the routing instance.
Source Interface (Required) Select the source interface that will be used to derive source address and the routing instance for the monitor probe. This interface determines the routing instance through which to send the probe packets. This routing instance is the target routing instance for the probe packets. Routing Instance Select the routing instance for the monitor object to use to reach the target IP addresses and FQDNs. Networks Select a network from the list of network names. IP Address Click to configure one or more IP addresses to monitor. You must configure either IP addresses or FQDNs. - IP Address (Required)
Click the Add icon, and then select the IP address to monitor. If you select more than one IP address, all the IP addresses must be reachable for the IP monitor to be applied (this is an AND condition).FQDN (For Releases 22.1.1 and later.) Click to configure one or more FQDNs to monitor. You must configure either IP addresses or FQDNs. - FQDN List (Required)
Click the Add icon, and then enter the FQDN to monitor. If you select more than one FQDN, all the FQDNs must be reachable for the IP monitor to be applied (that is; it is an AND condition). When you configure FQDNs, you must also configure the system DNS server to use for the name resolution. - Select the Damping tab and enter the following information.

Field Description Penalty Enter the penalty value. The penalty value increases by this amount each time the monitor flaps (for example, 1000 per flap). Suppress Threshold Enter the suppress threshold. When the penalty value increases to this threshold level, the monitor is dampened.
Range: 0 through 999999999
Default: 3000
Reuse Threshold Enter the reuse threshold. When the penalty value decreases to this threshold level, the monitor is restored from the suppressed (dampened) state and can be reused.
Range: 0 through 999999999
Default: 750
Half Life (min) Enter the time interval after which the penalty would be reduced by half.
Range: 0 through 9999
Default: 15 minutes
Maximum Suppress Time (min) Enter the maximum duration after which the the suppressed monitor is unsuppressed, regardless of the value of penalty.
Range: 0 through 9999
Default: 60 minutes
Enabled Click to enable IP-SLA damping. IP-SLA damping is disabled by default. - Click OK.
Associate an IP SLA Monitor Object with a Static Route
To associate an IP SLA monitor object with a static route in a virtual routing instance:
- In Director view:
- Select the Configuration tab in the top menu bar.
- Select Devices > Devices in the horizontal menu bar.
- Select an organization in the left menu bar.
- Select a branch or Controller in the main pane. The view changes to Appliance view.
- Select the Configuration tab in the top menu bar.
- Select Networking
 > Virtual Routers in the left menu bar
 - Select a virtual router instance.
- In the Edit VR popup window, select the Static Routing tab.
- Select the IPv4/IPv6 Unicast tab in the horizontal menu bar.
- Click the Add icon to add a static route to associate with the monitor object. If you are adding an IP SLA monitor to an existing static route, click the name of the static route in the Destination column.

- In the Edit Static Route popup window, in the Monitor field, select the Monitor object to monitor the static route on an IP address. If no response is received from the IP address after the configured threshold value, the static route is withdrawn.

- Click OK.
Associate an IP SLA Monitor Object with a Redistribution Policy Term
To associate an IP SLA monitor object with a redistribution policy term for a virtual routing instance:
- In the Director view:
- Select the Configuration tab in the top menu bar.
- Select Devices > Devices in the horizontal menu bar.
- Select an organization in the left menu bar.
- Select a branch or Controller in the main pane. The view changes to Appliance view.
- Select the Configuration tab in the top menu bar.
- Select Networking > Virtual Routers in the left menu bar
- Select a virtual router instance.
- In the Edit VR popup window, select the Redistribution Policies tab and click a redistribution policy name. The Edit Redistribution Policy screen displays.

- Click a term name. The Edit Redistribution Policy Edit Term screen displays.

- Click the Monitor or Monitor Group button, and select an object to monitor an IP address.
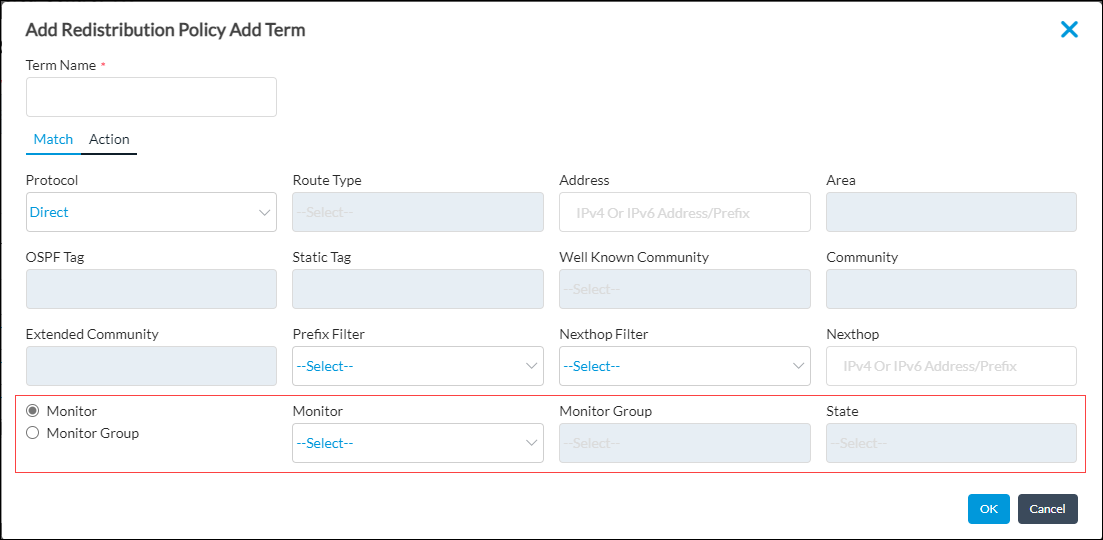
- Click OK.
Configure SLA Monitor Optimization
For Releases 21.2.1 and later.
To optimize the behavior of an SLA monitor on a VOS device, you can set SLA options to damp link flaps, and you can enable and configure SLA monitor log optimization.
VOS devices perform SLA monitoring of SD-WAN paths to check the health of the paths. The VOS device marks a path Down if three back-to-back SLA protocol data units (PDUs) are lost, and it marks the path back Up when it again receives an SLA PDU response. As the path changes state between Up and Down, which is known as a flap, many events are triggered, such as alarm generation and traffic-steering evaluation. When frequent flaps occur because of lossy links, this large number of events can cause unpredictable behavior. To avoid this behavior, you can set SLA monitor options to damp the flaps.
By default, the number of flaps is counted every 60 seconds, which is called the damping interval. If the number of flaps exceeds ten in this interval, which is the flap threshold, the VOS device stops noting path state changes until the path remains stable for 300 seconds (which is the damp clear interval). You can change the flap threshold, damp interval, and damp clear interval by editing the SLA monitor options.
By default, SD-WAN SLA monitor logging is done every 5 minutes on every active path of a VOS device. In networks with thousands of devices configured in full-mesh, partial-mesh, or hub-and-spoke topologies, a large number of logs is generated even when you configure adaptive monitoring. The large number of logs can cause scaling and performance issues on Analytics nodes and can lead to a lag when you are viewing recent log data. To avoid this situation, you can enable and configure SLA monitor log optimization.
You configure SLA monitor log optimization in the SLA monitor settings for a VOS device. When you enable log optimization, you set a threshold for the average number of SLA monitor logs sent every 5 minutes from the VOS device. If the threshold is exceeded, the VOS device enters log optimization mode. In this mode, for certain metrics, such as those that fluctuate very little over a time period, the VOS device aggregates the metrics in multiple logs into a single log, thus reducing the number of logs sent. The VOS device remains in log optimization mode for 60 minutes, and then the threshold is checked again. If the average number of logs is less than the threshold, the device reverts to the default log mode. You cannot change the amount of time that the VOS device is in log optimization mode.
To configure SLA monitor optimization:
- In Director view:
- Select the Configuration tab in the top menu bar.
- Select Devices > Devices in the horizontal menu bar.
- Select an organization in the left menu bar.
- Select a branch or Controller in the main pane. The view changes to Appliance view.
- Select the Configuration tab in the top menu bar.
- Select Services
 > SD-WAN > System > SLA Monitor in the left menu bar. The main pane displays the SLA Monitor pane.

- Click the
 Edit icon. In the Edit SLA Monitor screen, enter information for the following fields.
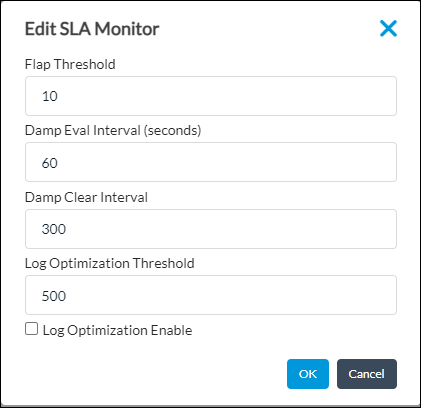
Field Description Flap Threshold Enter the flap threshold.
Range: 2 through 100Default: 10
Damping Evaluation Interval Enter the damping evaluation interval.
Range: 60 through 300 seconds
Default: 60 seconds
Damping Clear Interval Enter the damping clear interval.
Range: 60 through 3600 seconds
Default: 300 seconds
Log Optimization Threshold When you enable SLA monitor log optimization, enter the threshold for the average number of logs sent every 5 minutes.
Range: 10 through 5000
Default: 500
Log Optimization Enable Click to enable SLA monitor log optimization. - Click OK.
Supported Software Information
Releases 20.2 and later support all content described in this article, except:
- Release 21.1.1 adds support for selecting a forwarding class for an IP SLA monitor to override the default forwarding class.
- Release 21.2.1 adds support for configuring SLA monitoring log optimization.
- Release 22.1.1 adds support for HTTP and HTTP raw monitor types and for monitoring using FQDNs.
- Release 23.1.1 adds support for IP-SLA damping.
Additional Information
Configure Stateful Interchassis HA
Versa Analytics Scaling Recommendations