Monitor Device Status
You use the Monitor dashboard to monitor the status of devices connected to the Versa Portal. The Monitor Dashboard screen for an instance displays general instance status and information about the network, network security, deployed devices, routing, Internet Protocol Security (IPsec) tunnels, and IP SLA.
If the network, network security, and devices are operational and active, the status message Everything looks good displays. If there are any issues with network, security, or devices, an alert displays.
This article describes how to monitor the network, security, and device settings from the Monitor dashboard.
Use the Monitor Dashboard
To monitor router status and activity from the Monitor dashboard:
- Click the Monitor icon in the left menu bar to open the Monitor dashboard.
- Hover over the site in the honeycomb to display the device-options card for the device, and then click Monitor.

- In the Monitor Dashboard screen, a message displays describing system status. You are prompted to investigate if there are alerts on the system. Click the Refresh icon at any time to update system status.

- Choose an option in the Monitor Dashboard screen:
- Network—Check LAN, WAN, routing, IPsec tunnel, and IP SLA status.
- Security—View a summary of URL category and reputation statistics.
- Device—Check device information and bandwidth usage.
Monitor Network Status
You use the Network screen to check the device's LAN and WAN settings; to monitor BGP routing; and to monitor IPsec tunnels. To retrieve the latest system status information from the device, you can click the Refresh icon on the Monitor > Monitoring Dashboard.
Monitor WAN Settings
You use the Network screen to check the device's WAN settings. The IP address is visible only when an interface is on.
To monitor WAN settings:
- Click the Monitor icon in the left menu bar to open the Monitor dashboard.
- Hover over the site in the honeycomb to display the device options card for the device.
- Click Monitor in the Actions column of the device options card to display the Monitor Dashboard screen.
- Click Network to open the Monitor screen to check the device network status, and then select LAN/WAN tab.

- Click Routes to check the status of the routing table. Use the Search feature to find a route.

- Click Ping on the Network Monitor screen to check that the router is available and connected.
- Enter a valid IP address or hostname to ping.
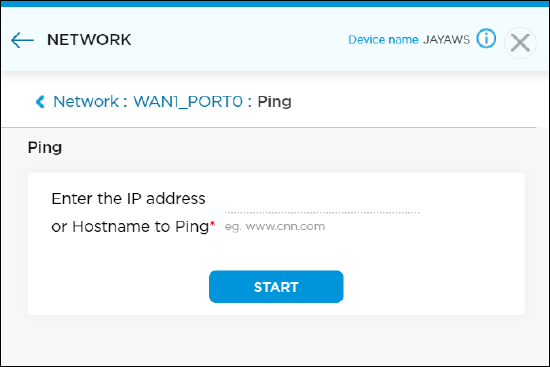
- Click Start.
- Click Traceroute on the Network Monitor screen to measure packet transit delays across the network.
- Enter a valid hostname or IP address in the Hostname/Address field.

- Click Start.
Monitor WAN Status
You can view WAN status on the Network screen. The WAN status can be on or off, up or down. The monitoring status is available only when the device is active.
To monitor WAN settings:
- Click the Monitor icon in the left menu bar to open the Monitor dashboard.
- Hover over the site in the honeycomb to open the option card for the device.
- Click Monitor in the Actions column of the device options card to display the Monitor Dashboard screen.
- Click Network to open the Monitor screen to check the device network status.
- Click WAN, and then click Access Circuit to view bandwidth usage for VPN (SD-WAN) and direct internet access (DIA).

- Click the menu bar at the bottom of the WAN screen to select a time frame to check access circuit bandwidth. The graph displays the BPS time interval in minutes, hours, and days:
- Last 15 minutes
- Last 30 minutes
- Last 1 hour
- Last 12 hours
- Last day
- Last 7 days
- Click OK to save the selection.

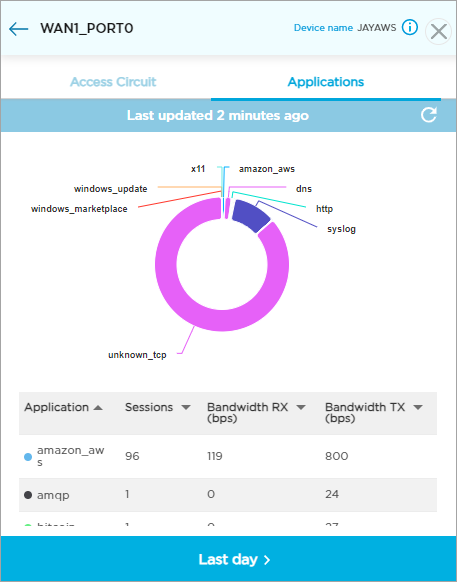
- Click WAN, and then click Applications to view the application bandwidth used. The graph displays the BPS time interval in minutes, hours, and days. You can sort the following details in the pie chart:
- Application
- Bandwidth RX (bps)
- Bandwidth TX (bps)
- Session
- Click the menu bar at the bottom of the WAN screen to select a time frame to check access circuit bandwidth.
- Click OK to save the selection.
Monitor LAN Status
You use the Network screen to check the device's LAN status. The LAN status can be on or off, up or down. The IP address is visible only when the interface is on.
To monitor LAN settings:
- Click the Monitor icon in the left menu bar to open the Monitor dashboard.
- Hover over the site in the honeycomb to display the device options card for the device.
- Click Monitor in the Actions column of the device options card to display the Monitor Dashboard screen.
- Click Network to open the Monitor screen to check the device network status, and then select the LAN/WAN tab.

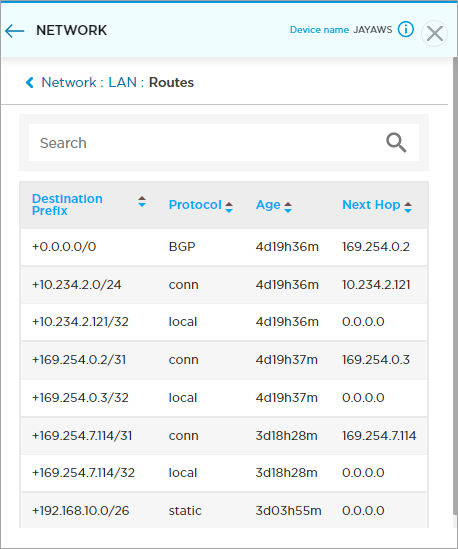
- In the LAN section, click Routes to check the status of the routing table. Use the Search feature to find a route. Select the VRF instance to monitor the routes.
- Click Ping to check whether the router is available and connected. Enter information for the following fields.

Field Description Enter the IP Address or Hostname to Ping (Required) Enter a valid LAN IP address or hostname. Source Interface Select a LAN interface to run the ping test. If you do not select a source interface, the system selects any LAN port that is up. - Click Start. The ping summary is displayed.

- Click Done.
- Click Traceroute to measure packet transit delays across the network.
- Enter a valid hostname or IP address.

- Click Start. The traceroute output displays.

- Click Done.
Monitor BGP Routing Status
BGP is a standard exterior gateway protocol (EGP) for routing traffic between devices in different autonomous systems (ASs). BGP defines network reachability based on IP prefixes that are part of an AS. In the routing process, connections are established between BGP routers or peers. A policy permitted route is stored in the route information base (RIB).
To view information about BGP:
- Click the Monitor icon in the left menu bar to open the Monitor dashboard.
- Hover over the site in the honeycomb to display the device options card for the device.
- Click Monitor in the Actions column of the device options card to display the Monitor Dashboard screen.
- Click Network to open the Monitor screen, and then select the Routing tab to check the routing network status.
- Select the BGP tab, and then select a BGP routing instance to view the BGP routing information for that routing instance.

Monitor Tunnel Status
IPsec is a set of protocols that is used to create tunnels for secure communications over IP networks by deploying cryptographic encryption services.
To monitor IPsec tunnels from the Versa Portal Monitor dashboard:
- Click the Monitor icon in the left menu bar to open the Monitor dashboard.
- Hover over the site in the honeycomb to display the device options card for the device.
- Click Monitor in the Actions column of the device options card to display the Monitor Dashboard screen.
- Click Network to open the Monitor screen to check the device network status.
- Select the IPsec tab and then select an IPsec tunnel to view information about the IPsec connection.

Monitor IP SLA Status
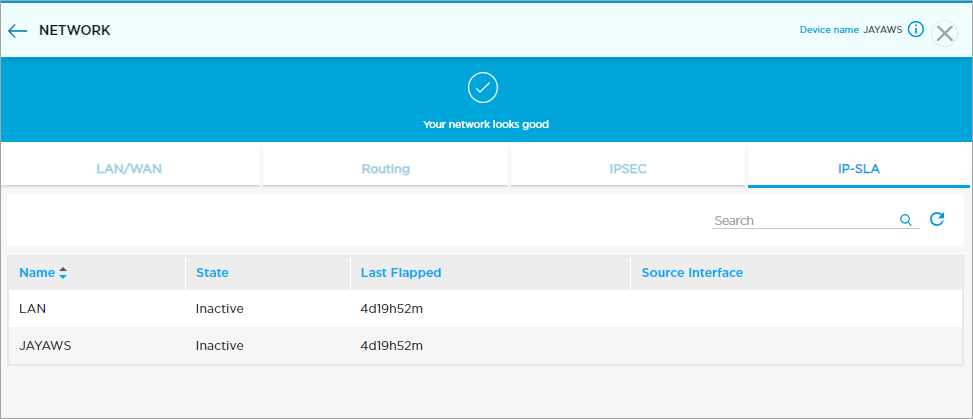
IP SLA monitoring is a method of actively and continuously monitoring traffic across the network and reporting about the traffic. When you configure VRRP, an SLA monitor for LAN is created and attached to the VRRP. You can monitor the state and source interface for configured IP SLA monitors.
To monitor the IP SLA state and metrics from the Versa Portal Monitor dashboard:
- Click the Monitor icon in the left menu bar to open the Monitor dashboard.
- Hover over the site in the honeycomb to display the device options card for the device.
- Click Monitor in the Actions column of the device options card to display the Monitor Dashboard screen.
- Click Network to open the Monitor screen to check the device network status, and then select the IP SLA tab.
Monitor Security Status
You use the Security screen to check the device URL category and reputation. To view the most current status, click the Refresh icon.
To monitor URL security status:
- Click the Monitor icon in the left menu bar to open the Monitor dashboard.
- Hover over the site in the honeycomb to open the option card for the device.
- Click Monitor in the Actions column of the device-options card to open the Monitor screen.
- Click Security > URL Category to open the Security screen to view all sites that have been blocked (blacklisted). The type and number of blocked sites are listed in graph form as a seven-day summary:
- To view records for a specif date, click the day of the week.
- To view lists of browsed websites that have been blocked, click Category and Count.
- To view the status in a pie chart format, click the graph.
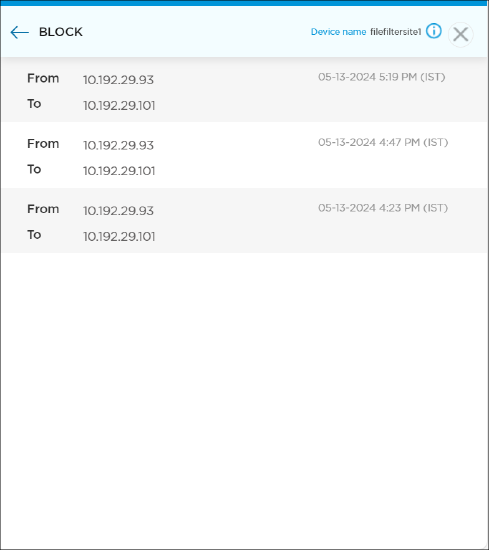
- Click an item in the list to open the website details window. Details include To and From information and when the site was blocked.

- Click Security > URL Reputation to view URL risk levels in a pie chart. The URL reputation can be one of the following:
- High Risk IP Address
- Suspicious IP Address
- Moderate Risk
- Low Risk
- Trustworthy
Risk Hits and Percentage display statistics related to information shown in the pie chart. To view links to individual websites, click the pie chart or the entry in the URL Reputation list.
- Click an item on the list to open the website details window. Details include To and From information and when the site was blocked.

- Click Security > File Filter > Top File-Filtering Action tab to view file-filtering actions in a pie chart. The file-filtering action can be one of the following:
- Alert
- Allow
- Block
- Reject

Click an action in the pie chart or action list to view more details.
- Click the Top File Type Denied tab to view denied file types in a pie chart.

Click a file type in the pie chart or file type list to view more details.

Monitor Device Information
You use the Device screen to check the device CPU, disk, and memory status, SD-WAN connectivity, and bandwidth usage. To view the most current status, click Refresh.
To monitor device status:
- Click the Monitor icon in the left menu bar to open the Monitor dashboard.
- Hover over the site in the honeycomb to open the option card for the device.
- Click Monitor in the Actions column of the device-options card to open the Monitor screen.
- Click Device to open the Device Information screen. Statistics automatically load showing overall device availability and CPU, disk, and memory use by percentage.
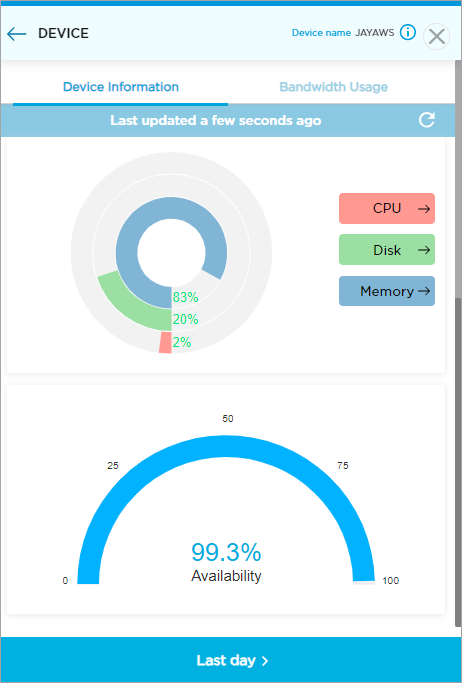
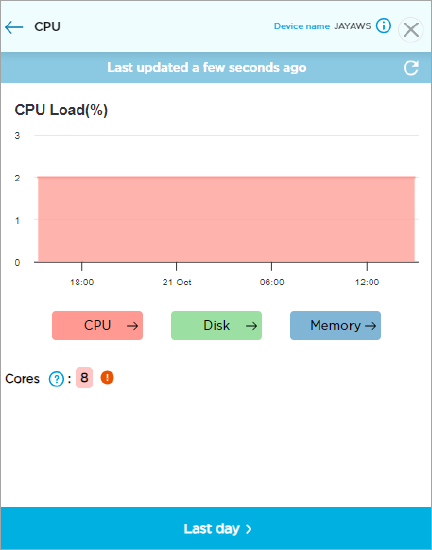
- To view CPU usage in graph form in a new window, click CPU.
- To select a time frame to capture CPU usage, click the menu bar at the bottom of the screen. Click OK to save the settings.
- Cores—Available only on virtual appliances (vCSG).
- The Information icon shows the subscribed cores and actual cores.
- To update the screen, click the Refresh icon.
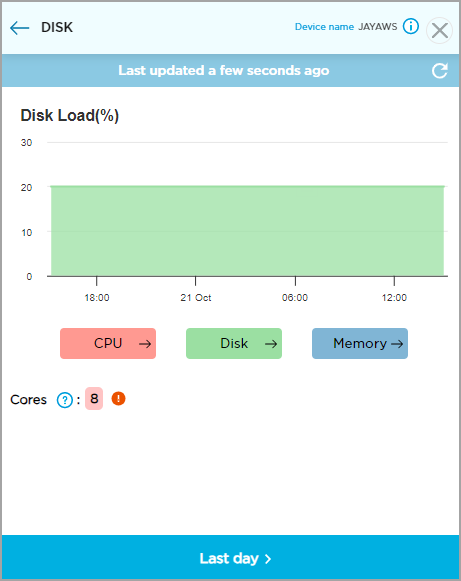
- To view disk load usage as a percentage in a new window, click the Disk.
- To select a time frame to capture disk load, click the menu bar at the bottom of the screen. Click OK to save the settings.
- Cores—Available only on virtual appliances (vCSG).
- The Information icon shows the subscribed cores and actual cores.
- To update the screen, click the Refresh icon.
- To view memory load as a percentage in a new window, click Memory:
- To select a specific time frame to capture memory load, click the menu bar at the bottom of the screen. Click OK to save the settings.
- Cores—Available only on virtual appliances (vCSG).
- The Information icon shows the subscribed cores and actual cores.
- To update the screen, click the Refresh icon.

Monitor Bandwidth Usage
To monitor device bandwidth:
- Click the Monitor icon in the left menu bar to open the Monitor dashboard.
- Hover over the site in the honeycomb that you would like to monitor to open the option card for the device.
- Click Monitor in the Actions column of the device-options card to open the Monitor screen.
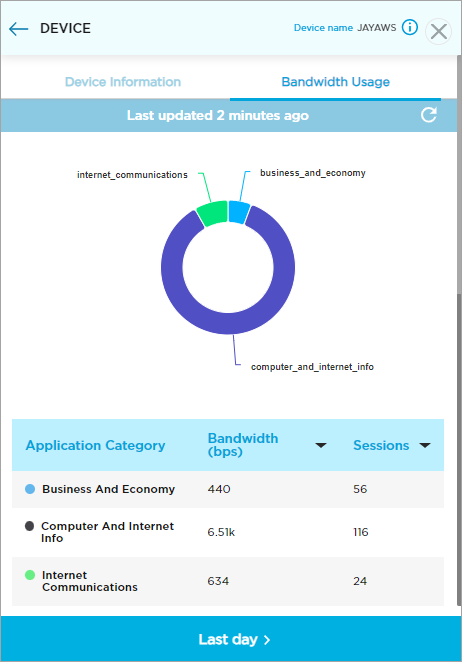
- Click Device > Bandwidth Usage to view device bandwidth status in a new window.
- Search for a device by name.
- Click the menu bar at the bottom of the screen to select a specific time frame to capture SD-WAN connectivity. Click OK to save the settings.
- Click the Refresh icon to update the screen.
