Concerto Deploy Lifecycle Overview
![]() For supported software information, click here.
For supported software information, click here.
You use the Deploy lifecycle to create sites and appliances within sites, associate appliances with master profiles, and specify bind variable values. You also use the Deploy life cycle to publish the configuration to the Director node and the device (if ZTP has been completed on the appliance).
Deploy Lifecycle Views
The Deploy lifecycle screen provides three ways to view sites:
- Honeycomb
- Map
- Table
These views are described below.
Honeycomb View
In the left menu bar, select Deploy to display all sites in Honeycomb view. This is the default view and is indicated by the ![]() Honeycomb icon at the top of the screen.
Honeycomb icon at the top of the screen.

Each site is displayed as a hexagon in the honeycomb. The types and colors of the lines of each site hexagon have different meanings:
- Dotted line—There is no communication between the Director node and the device site.
- Gray line—The device has never connected to the Director node through the ZTP process.
- Other colors—The lines around each site hexagon are color-coded to indicate the highest-level active security alarm for the site:
- Red—Critical
- Orange—Major
- Gray—Minor
- Blue—Informational
The hexagon view displays the following information:

The ![]() Gear icon indicates that the publication status requires you to take an action. Hover over the
Gear icon indicates that the publication status requires you to take an action. Hover over the ![]() Gear icon to see the required action. The publication status messages are:
Gear icon to see the required action. The publication status messages are:
- Pending Profile—An appliance has been created at a site but has not been assigned a profile.
- Pending Variables—A profile has been assigned to an appliance, but values for appliance-specific variables have not been entered.
- Pending Publication—An appliance's configuration profile has not been published to Versa Director.
- Failed Publication—An appliance's configuration profile was not successfully published to Versa Director.
The following figure shows that the variables need to be configured on one device. Hovering over a site hexagon also displays the actions you can take, which are Set Profile, Publish, and Edit Site.

To display the number of alarms for the site, hover over the Alarms box. The alarm boxes are color coded, as follows:
- Red—Critical
- Orange—Major
- Gray—Minor
- Blue—Informational

To display alarm details, click the Alarms box.

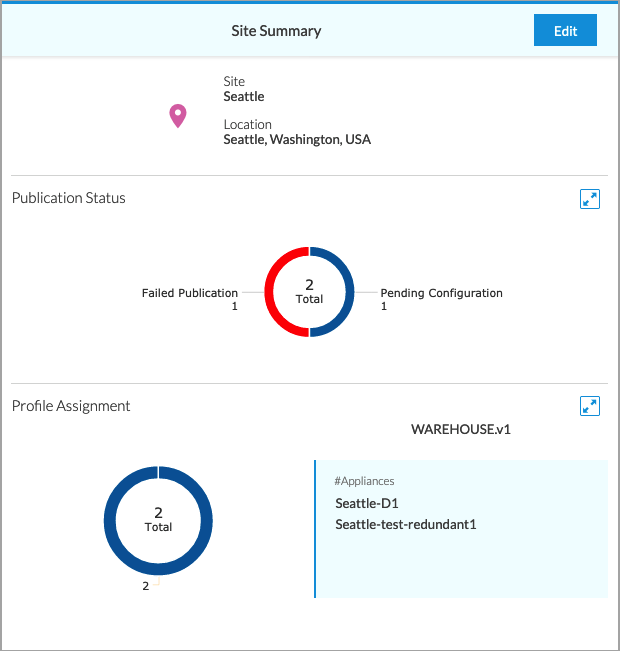
To display summary information for an individual site, click a site hexagon. The Site Summary panel for that site displays on the right. To display a detailed view of the Publication Status or Profile Assignments for all sites or for the selected site, click the ![]() Expand icon in the Site Summary section.
Expand icon in the Site Summary section.

To display the action menu for a site in the main pane, hover over the site hexagon. The action menu is played:

Hub devices are displayed at the top of the screen.

To display hub details, click the circled number.

Map View
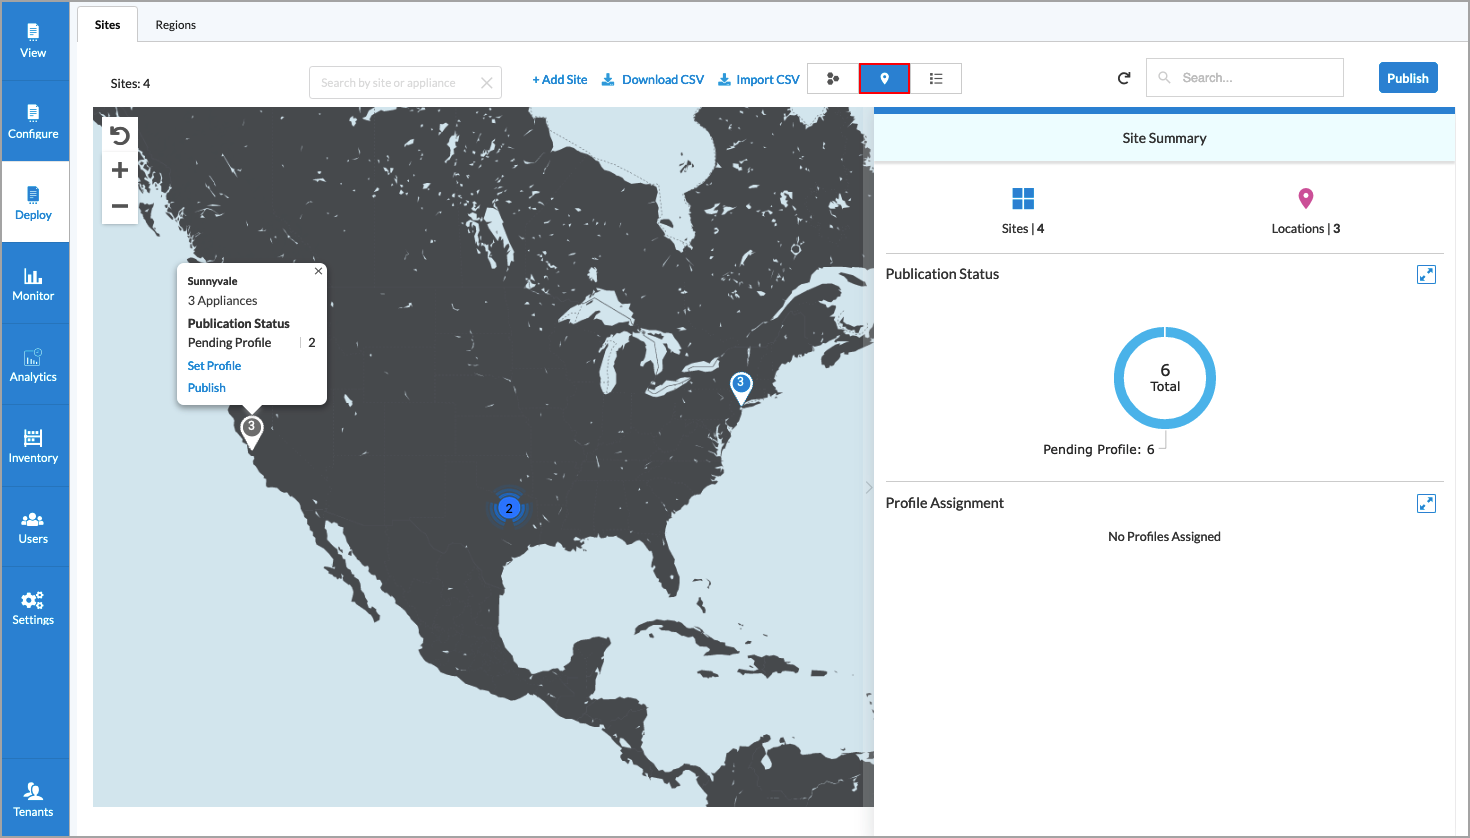
To display all sites in Map view, click the ![]() Map icon.
Map icon.

To display the number of appliances at the site and to display an action menu, hover over a site. For information on setting a profile, see Configure Appliances, Hubs, and Hub–Controllers.
Table View
To display all sites in Table view, click the ![]() Table icon.
Table icon.

For information about using the Deploy lifecycle, see Configure Appliances, Hubs, and Hub–Controllers.
Supported Software Information
Releases 10.1.1 and later support all content described in this article, except:
- Release 10.2.1 adds support for configuring regions, Layer 2 wired and wireless interfaces on an appliance, and IRB interfaces.
Additional Information
Configure Appliances, Hubs, and Hub–Controllers
Download the Global Publishing Status
