Versa Analytics and CrowdStrike NG-SIEM Integration
![]() For supported software information, click here.
For supported software information, click here.
The VersaONE™ Universal SASE platform integrates Secure Access Service Edge (SASE), Secure Services Edge (SSE), SD-WAN, next-generation firewall (NGFW), and SD-LAN to securely connect users, devices, workloads, and networks through a unified platform. The platform supports many log types including flow logs, SD-WAN path and bandwidth usage, CGNAT, DHCP, DNS, SASE-web monitoring, secure access, traffic conditioning, URL filtering, and IDP logs. You can export these logs from SD-WAN devices, SASE edge devices, hubs, and gateways to Versa Analytics nodes, and then stream the logs to CrowdStrike™.
This article describes how to configure Versa Analytics nodes to stream logs to CrowdStrike, and how to configure CrowdStrike to receive the logs.
CrowdStrike must meet the following requirements to receive logs from Versa Analytics:
- Subscription to Falcon Next-Gen SIEM or Falcon Next-Gen SIEM 10GB
- CrowdStrike cloud environment US-1, US-2, or EU-1
- CrowdStrike access and permissions
- Administrator or Connector Manager access to the Falcon console for the respective CrowdStrike Falcon Client ID (CID)
To configure Versa Analytics to stream logs to CrowdStrike, you do the following:
- Configure and activate a data connector
- Configure Falcon LogScale collector instances
- Configure remote collectors and exporter rules on Versa Analytics log-forwarder nodes
Versa Analytics Log Format
Versa logs begin with a timestamp followed by the log type name. The timestamp is in the following format:
yyyy-mm-ddThh:mm:ss+UTC-offset
The remainder of the log consists of comma separated key-value pairs. For information about log types, see Versa Analytics Log Collector Log Types.
The following example is of the log type accessLog.
2025-02-28T00:07:58+0000 accessLog, applianceName=SaseGateway,
      tenantName=Corp-Inline-Customer-1, flowId=3259710425, flowCookie=1740701273,
      flowStartMilliseconds=1740701273077, flowEndMilliseconds=1740701273083, sentOctets=176,
      sentPackets=2, recvdOctets=208, recvdPackets=2, appId=108, eventType=end, tenantId=1,
      urlCategory=, action=allow, vsnId=0, applianceId=1, appRisk=2, appProductivity=3,
      appIdStr=dns, appFamily=networking, appSubFamily=network-service, rule=Allow_To_SDWAN,
      forwardForwardingClass=fc_af, reverseForwardingClass=fc_af, host=, deviceKey=Unknown,
      deviceName=Unknown, sourceIPv4Address=10.0.35.224, destinationIPv4Address=10.48.0.99,
      sourceTransportPort=1505, destinationTransportPort=53, protocolIdentifier=17,
      fromUser=Unknown, eipProfileName=, traffScope=none, srcSGT=, destSGT=, ucsScore=0,
      ucsBand=, ucsReason="", urlReputation=undefined, urlLookupSrc=, protocolInfo="",
      policyActionName=allow, policyActionModule=policy, ecsScore=0, ecsBand=unknown,
      ecsReason="", appAuth=Uncategorized
Configure and Activate the Versa Unified SASE Data Connector
You activate the Versa Unified SASE data connector in the CrowdStrike Falcon console.
Note: It is recommended that you use the versa-sase parser as the default parser for this data connector. This parser requires logs to be in syslog format before using the data connector.
To configure the data connector:
- In the Falcon console, go to Data Connectors > Data Connectors > Data Connections.
- Click + Add connection.
- In the Data Connectors page, select the connector to configure. To find the connector, you can filter or sort by:
- Connector name
- Vendor
- Product
- Connector Type
- Author
- Subscription
- In the New Connection dialog, review the connector metadata, version, and description.
- Click Configure. Note that if the connector is in a pre-production state, a warning dialogue appears.
- Click Accept to continue the configuration.
- In the Add New Connector page, enter a name and optional description to identify the connector.
- Click the checkbox to accept the Terms and Conditions, then click Save. A banner message appears in the Falcon console when your API key and API URL are ready to be generated.
- To generate the API key:
- Go to Data Connectors > Data Connectors > Data Connections.
- Click the Open menu for the data connector.
- Click Generate API key.
- Copy and safely store the API key and API URL to use during connector configuration.
Tip: Ensure that you record your API key when it is displayed. It displays only once during connector setup.
Configure Falcon LogScale
You configure Falcon LogScale collectors to receive logs streamed from Analytics log forwarder nodes. It is recommended that you install the Falcon LogScale collector instance in the same network as the Versa Analytics log forwarder nodes.
You are responsible for the security hardening of the Falcon LogScale collector instances for Versa Analytics on-premise deployments. For Versa-hosted and Versa-managed deployments, please contact the Versa Networks Support team to deploy this connector. Versa recommends running LogScale on a Linux machine.
The size of your Falcon LogScale collector instance depends on workload. See the LogScale Collector Sizing Guide.
To configure the LogScale collector:
- In the Falcon console, go to Support and Resources > Resources and Tools > Tool Downloads.
- Install the LogScale collector based on your operating system; for example, LogScale Collector for Windows - X64 v1.6.6.
- Open the LogScale collector configuration file, config.yaml, in a text editor. For the file location, see Create a Configuration — Local.
- Edit the config.yaml file. The following examples show configuration files for various operating systems:
- Linux
dataDirectory: /var/lib/humio-log-collector
sources:
  #ingest syslog tcp 514.
  syslog_tcp_514:
    type: syslog
    mode: tcp
    port: 514
    sink: humio
sinks:
  humio:
    type: hec
    proxy: none
    token: <generated_during_installation>
    url: <generated_during_installation>
- Windows
dataDirectory: C:\ProgramData\LogScale Collector\
sources:
  syslog_port_514:
    type: syslog
    mode: udp
    port: 514
    sink: humio
sinks:
  humio:
    type: hec
    proxy: none
    token: <generated_during_installation>
    url: <generated_during_installation>
● Mac
dataDirectory: /var/local/logscale-collector
sources:
  syslog_port_514:
    type: syslog
    mode: udp
    port: 514
    sink: humio

sinks:
  humio:
    type: hec
    proxy: none
    token: <generated_during_data_connector_setup>
    url: <generated_during_data_connector_setup>
- Verify that the sources and sinks sections of the config.yaml configuration are correct:
- Check that no other services are listening on port 514. For example, the following command is commonly used to check for listening ports on Linux:
sudo netstat -lpn
- If port 514 is not available, select a different port and confirm it is not in use. Update the port number.
- If you are configuring multiple sources in the same configuration file, each sink must have a distinct port. For example, you cannot have two Humio sinks listening on port 514.
- Check the local firewall and confirm that the configured port is not being blocked.
Note: For a Windows firewall, you must add the LogScale collector to your traffic allow list.
- Add the token and URL generated in Configure and Activate the Versa Unified SASE Data Connector, above.
- Remove "/services/collector" from the end of the URL.
- Check that no other services are listening on port 514. For example, the following command is commonly used to check for listening ports on Linux:
- Save and exit the config.yaml file.
- Start the Falcon LogScale collector using the instructions for your operating system:
- Linux—Issue the following command from the shell:
sudo systemctl start humio-log-collector
- Windows—Look for Services in the searchbar. Then, open Services, find Humio Log Collector, and right-click Restart.
- Mac—Issue the following command from the shell:
sudo launchctl kickstart -k system/com.crowdstrike.logscale-collector
- Linux—Issue the following command from the shell:
Configure Versa Analytics to Stream Logs to CrowdStrike
Versa Analytics nodes receive and stream logs through the log collector exporter (LCE) that runs on each log-forwarder node. Logs from Versa Operating SystemTM (VOSTM) devices, such as branches and gateways, are received through a component of the LCE called a local collector. There is typically a single local collector configured on each Analytics log-forwarder node.
To stream logs from a local collector to a Falcon LogScale instance, you configure a remote collector for the instance, and then configure exporter rules to indicate which logs to export.
To configure Analytics nodes to stream logs to CrowdStrike:
- In Director view, select the Analytics tab.
- Select Administration > Configuration> Log Collector Exporter. The Log Collector Configuration screen displays.

- In the Driver Hosts field, select the log-forwarder node.
- Select the Local Collector tab. Note the name of the local collector (in the example above, collector1).
- Select the Remote Template tab. Remote templates determine the exported log format.

- Click +Add. The Remote Template popup window displays.
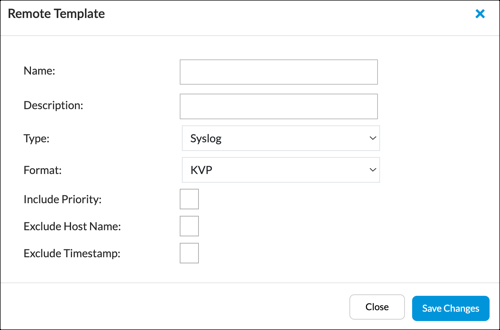
- Enter information for the following fields. For CrowdStrike Falcon logs must be exported in syslog key-value pair (KVP) format.
Field Descriptions Name Enter a name for the template. Description Enter a description for the template. Type Select syslog. Format Select KVP. - Click Save Changes.
- Select the Remote Collector tab.
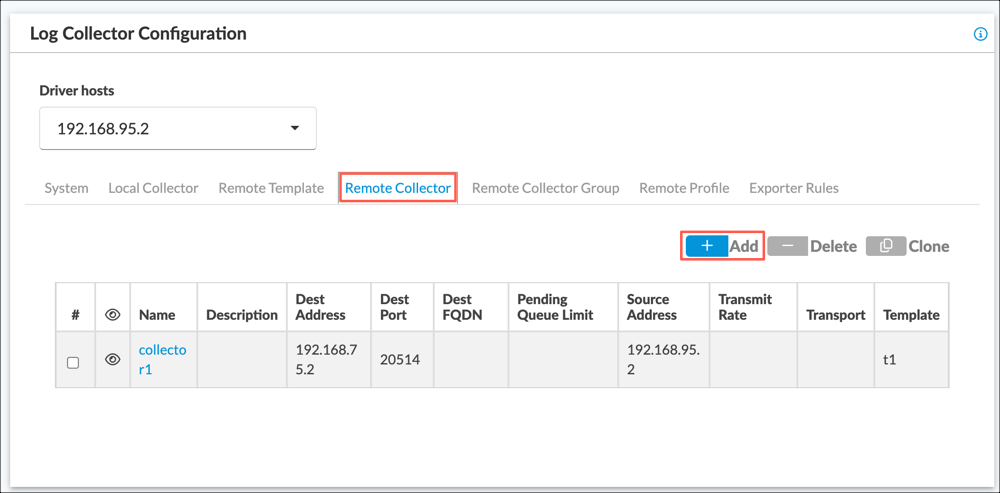
- Click +Add. The Remote Collector popup window displays.

- Enter information for the following fields.
Field Description Name Enter a name for the remote collector. Destination Address Enter the IP address of the Falcon LogScale instance, Destination Port Enter the port number of the Falcon LogScale instance. Type Select TCP. Template Select the remote template you configured in Step 7, - Click Save Changes.
- Select the Remote Profile tab.

- Click +Add to display the Remote Profile popup window. Enter information for the following fields.

Field Description Name Enter a name for the Remote Profile. Remote Collector Click, and then select a remote collector from the drop-down list.
- Click Save Changes. Note that the configuration in this procedure supports streaming logs to a single CrowdStrike Falcon collector instance. To stream logs to multiple instances, you can configure collector groups and a collector group list. For more information about configuring these components of the log collector exporter, see Configure Log Collectors and Log Exporter Rules.
- Select the Exporter Rules tab. Exporter rules determine which types of logs to stream from a local collector to the remote collector or collectors associated with a remote profile.

- Click +Add. The Export Rules popup window displays. Enter information for the following fields.

Field Description Name Enter a name for the rule. Local Collector Select the local collector you noted in Step 4. Log Types Select the types of logs to stream to CrowdStrike. If no log types are selected, then logs of all types are exported. For information about log types, see Analytics Log Collector Log Types Overview. Remote Collector Profile Select the remote profile you saved in Step 15. - For information about the remaining fields, see Configure Log Exporter Rules in Configure Log Collectors and Log Exporter Rules.
- Click Save Changes.
Note: The output HTTP configuration forwards the logs to the Versa SASE data connector in CrowdStrike. Replace API_url and API_key with the API URL and key you generated and saved in Configure and Activate the Versa Unified SASE Data Connector, above.
input {
tcp {
      port => 5000
      }
}
output {
stdout {}
http {
      url => "{API_url}"
      http_method => "post"
      headers => {
           "Authorization"
           => "Bearer {API_key}"
           "Content-Type"
           => "application/json"
      }
      codec => "plain"
     }
}
Verify Successful Data Ingestion
Before verifying successful data ingestion, wait at least 15 minutes after setup to allow initial event data to be generated. Search results are not generated until an applicable event occurs. If an event timestamp is greater than the retention period, the data is not visible in search. If you do not see the raw data after 15 minutes, you may need to allow more time.
To verify that data is being ingested and appears in Next-Gen SIEM search results:
- In the Falcon console, go to Data Connectors > Data Connectors >Data Connections.
- In the Status column, verify that the data connection status is Active.
- In the Actions column, click Open Menu, and then select Show Events.
- Note the events related to this data connection in Advanced Event Search.
- Confirm that at least one match is generated.
Supported Software Information
Releases 21.2 and later support all content described in this article.