Monitor Analytics Clusters Using Open Source Tools
![]() For supported software information, click here.
For supported software information, click here.
The Versa Analytics platform consists of a cluster of analytics, search, and log collector and forwarder nodes that you can deploy on a physical server or virtual machine (VM). The cluster nodes run various software components such as databases, applications, and client drivers, all of which use CPU, memory, disk, and input/output resources. To ensure high availability and optimal performance of the Analytics platform, you should periodically monitor the health of the software components and resources.
You can monitor Analytics platform using the Prometheus monitoring system, and you can query the data collected by Prometheus and visualize it using the Grafana observability platform. Prometheus is an open-source systems monitoring and alerting toolkit that collects and aggregates metrics from various endpoints and stores them in a time-series database. The Grafana service allows you to query, visualize, and alert on metrics and logs. The following figure illustrates how to use Prometheus and Grafana to monitor an Analytics platform.
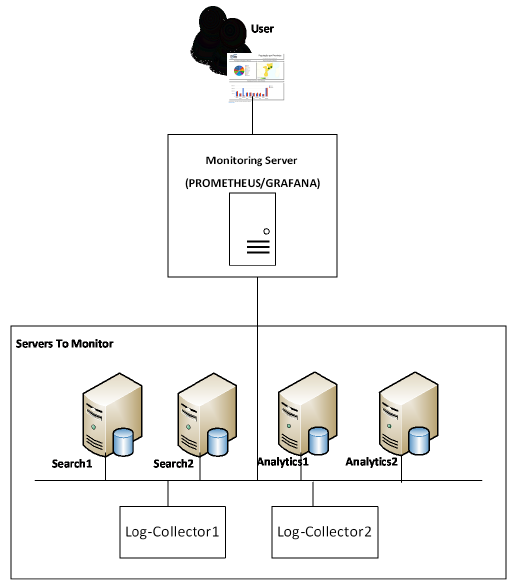
To use the Prometheus and Grafana tools, you install a monitoring agent on the Analytics platform and you configure a dedicated Ubuntu VM to be a monitoring server. You can then connect to the Prometheus server to view its configuration and rules, and you can connect to. the Grafana server to display metrics and alerts. You can configure the Grafana server to send email and other types of notifications.
Install Monitoring Agents and Servers
To connect to Prometheus and Grafana monitoring servers, you must install the following components on the Analytics platform:
- Monitoring agents—Install and enable on each Analytics nodes that is to be monitored.
- Monitoring server—Install and enable on an Ubuntu server that has reachability to the monitoring agents.
Install Monitoring Agents
Monitoring agents respond to the REST requests from the Prometheus server for retrieving metrics. There are two types of monitoring agents:
- Node monitoring agent—Provides hardware and operating system metrics about the Analytics node
- VAN monitoring agent—Provides metrics about Analytics nodes and resources
Install the Node Monitoring Agent
The node monitoring agent provides hardware and operating system metrics about the Analytics node. This agent uses the Prometheus node_exporter software to export the data. By default, it opens TCP port 8020.
To install node monitoring agent on a node in the Analytics cluster, issue the following command:
admin@Analytics$ cli
admin@Analytics> request system monitoring-agent node install
For example:
admin@Analytics> request system monitoring-agent node install
status success
result Installation initiated ... check /var/log/versa/nodemon-agent.log
To check the status of the monitoring agent on the node, issue the following command:
admin@Analytics> request system monitoring-agent node status
For example:
admin@Analytics> request system monitoring-agent node status
status success
result Checking nodemon-agent     running (pid: 2411)
To check whether the node-monitoring service is running, issue the following command:
admin@Analytics$ sudo netstat -pant | grep 8020
For example:
admin@Analytics$ sudo netstat -pant | grep 8020
tcp6     0     0 :::8020     :::*     LISTEN     2411/nodemon-agent
To change the IP address and port number bound to the node monitoring agent, edit the nodemon-agent.conf file in the /opt/versa_van/apps/nodemon-agent/etc/ directory.
Install the VAN Monitoring Agent
The VAN monitoring agent provides Versa Analytics metrics about the Analytics nodes, resources, and components . By default, it opens TCP port 8010.
To install the VAN monitoring agent, issue the following command:
admin@Analytics> request system monitoring-agent service install
For example:
admin@Analytics> request system monitoring-agent service install
status success
result Installation initiated ... check /var/log/versa/vanmon-agent.log
To check the status of the monitoring agent service, issue the following command:
admin@Analytics> request system monitoring-agent service status
For example:
admin@Analytics> request system monitoring-agent service status
status success
result Checking vanmon-agent         running (pid: 10378)
To check whether the monitoring-agent service is running, issue the following command.
admin@Analytics$ sudo netstat -pant | grep 8010
For example:
admin@Analytics$ sudo netstat -pant | grep 8010
[sudo] password for versa:
tcp     0     0 0.0.0.0:8010     0.0.0.0:*     LISTEN     10378/python
To change the IP address and port number bound to the VAN monitoring agent, edit the vanmon-agent.conf file in the /opt/versa_van/apps/vanmon-agent/etc/ directory.
Install the Monitoring Server
The monitoring server runs on a dedicated Ubuntu VM, running Ubuntu version 14.04. The VM must have a minimum of 4 core CPUs, 4 GB RAM, and 64 GB disk space, and it must be reachable by the monitoring agents.
The monitoring server runs in a Docker container.
To download the monitoring server package and install it:
- If necessary, install the Docker container on the Ubuntu server:
$ sudo apt-get update
$ sudo apt-get install docker.io
- Download the monitoring server package, vanmon-server, from the following location: https://versanetworks.app.box.com/s/...vzq4rxhcqbdsqz
- Install the monitoring server package:
$ sudo dpkg -i vanmon-server_2.2.deb
- Start the monitoring server:
$ sudo service vanmon-server start
Other options available with this command are restart, status, and stop.
-
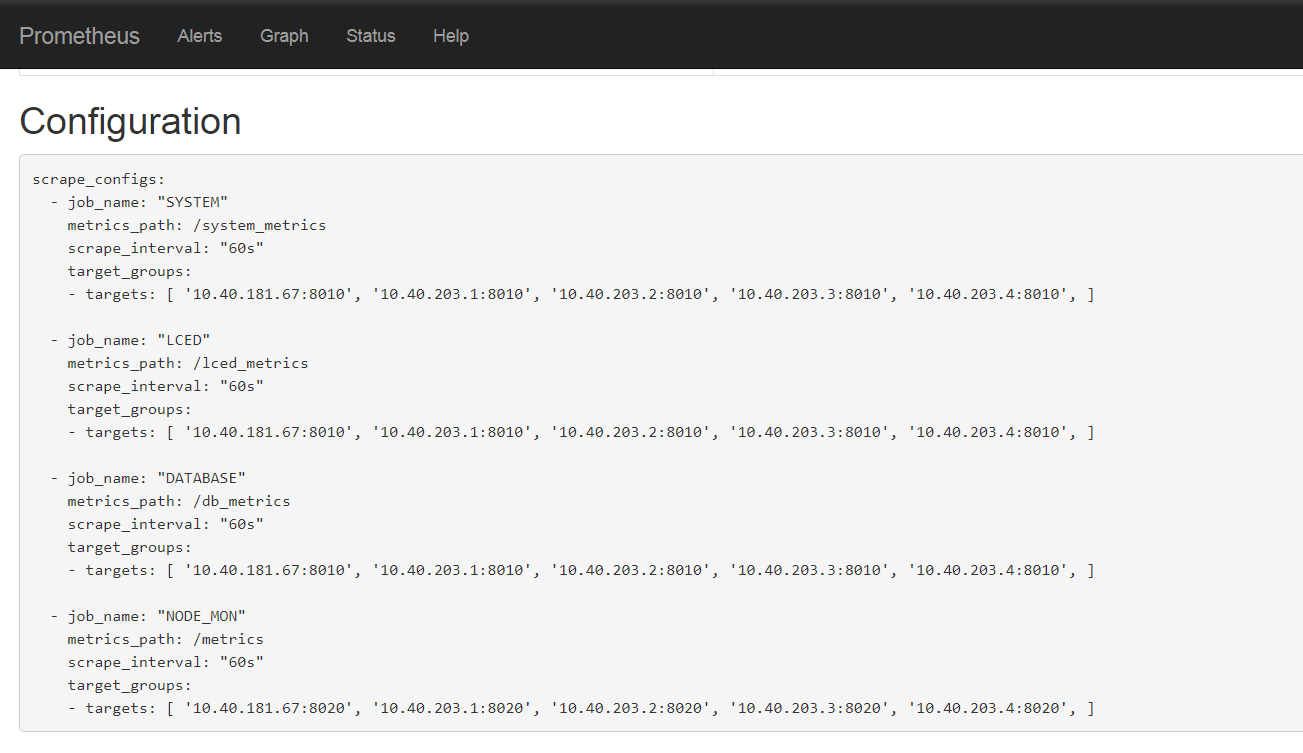
Edit the /opt/vanmon-server/etc/conf/prometheus/prometheus.yml configuration file to configure the monitoring server to collect (scrape) the desired metrics from the Analytics nodes that are running monitoring agents. In the targets field, replace the values with the IP address and port bindings for the monitoring agents. Ensure that these IP addresses are reachab.e from the monitoring server and that the ports are open. Do not change any other values in the configuration.

-
Restart the monitoring service by issuing the sudo service vanmon-server restart command. For example:
$ sudo service vanmon-server restart
===> Stopping vanmon-server
Prometheus is Stopped
Grafana is Stopped

===> Starting vanmon-server
Prometheus is Started
Grafana is Started
To check status of the monitoring server, issue the following command:
$ sudo service vanmon-server status
===> Status of vanmon-server
Prometheus is Running
Grafana is Running
For example:
$ sudo service vanmon-server status
===> Status of vanmon-server
Prometheus is Running
Grafana is Running
Monitor the Analytics Nodes
Prometheus and Grafana provide web access to view the configuration, status, and statistics of an Analytics node that is configured to be monitoring server.
Monitor Using Prometheus
To monitor the Analytics nodes using Prometheus, connect to the Prometheus server at the URL http://monitoring-server-ip-address:9090.
To view the Prometheus configuration and rules, select the Status tab in the top menu bar:

Monitor Using Grafana
To monitor the Analytics nodes using Grafana, connect to the Grafana server at the URL http://monitoring-server-ip-address:3000. When you log in for the first time, enter the username and password as admin/admin. After you log in, Grafana prompts you to change the default password.

To view the Grafana dashboard, click the Home drop-down.

Select one of the following options:

- Node Metric—Displays monitoring data for the node
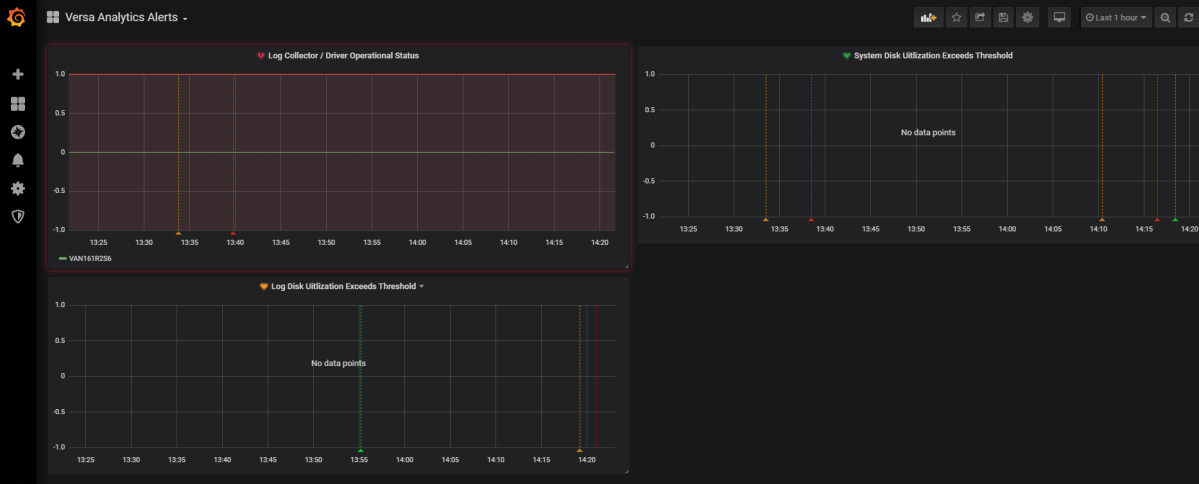
- Versa Analytics Alerts—Displays Versa Analytics metrics that are configured with alerts
- Versa Analytics Monitoring—Displays monitoring data about Analytics resources and components
When you click Node Metrics, choose a specific host or multiple hosts in the Host drop list to display information about the host or hosts:

When you click Versa Analytics Monitoring, information about the Analytics node displays:

When you click Versa Analytics Alerts, information about Analytics alerts displays:
Configure Alerts on Grafana
You can configure email notifications and alerts for any metrics that Grafana is monitoring. The alerts can be using SMTP, a notifier alert, and a custom notification channel.
Grafana does not allow you to edit the of backend provisioned dashboards. However, you can use provisioned dashboards as templates to build custom dashboards.
Configure SMTP Alerts
You can configure Grafana to send email notifications and alerts to an external server. To do this, edit the grafana.ini file in the /opt/vanmon-server/etc/conf/grafana/ director. Enter information for the following fields.

| Field | Description |
|---|---|
| enabled | Set to true to send email alerts using an external SMTP server. |
| host | Enter the IP address or FQDN of the SMTP server and the port to connect to on the server. |
| user | Enter the email address of the user logging in to the SMTP server. |
| password | Enter a password to use to connect to the SMTP server. A password is optional. |
| from_address | Enter the email address to list as the sender of the alerts |
Configure Notifier Alerts
You can update the email addresses in the notifier that is associated with alerting rules. To do this, edit the /opt/vanmon-server/etc/conf/grafana/provisioning/notifiers/versa-mon.yaml file. In the addresses field, replace the email address admin@example.com with one or more email addresses, separating address with asemicolon (;) (for example, admin@expample.com; provider@example.com).

Then restart the vanmon-server by issuing the sudo service vanmon-server restart command.
Configure Custom Notification Channels
To create a custom notification channel:
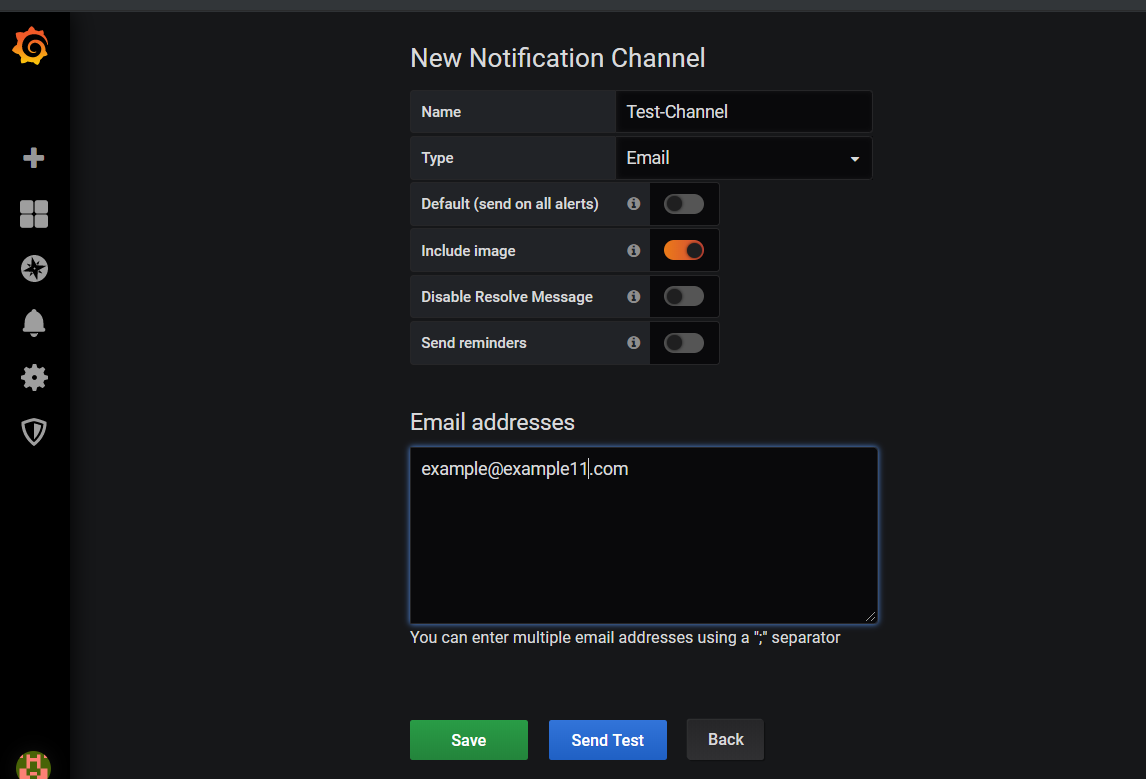
- On the Grafana home page, click Alerting icon and then click Notification Channels.

- In the New Notification Channel page, enter information for the following fields.
| Field | Description |
|---|---|
| Name | Enter a name for the notification channel. |
| Type | Select the notification channel type. |
| Default (send on all alerts) | Select to send a notification on this channel for all alert rules. |
| Include Image | Select to include any images. |
| Disable Resolve Message | Select to disable the resolve message. |
| Send Reminders | Select to send any reminders. |
| Email Addresses | Enter the email addresses to which to send the notification. |
- Click Send Test to send a test notification.
- Click Save.
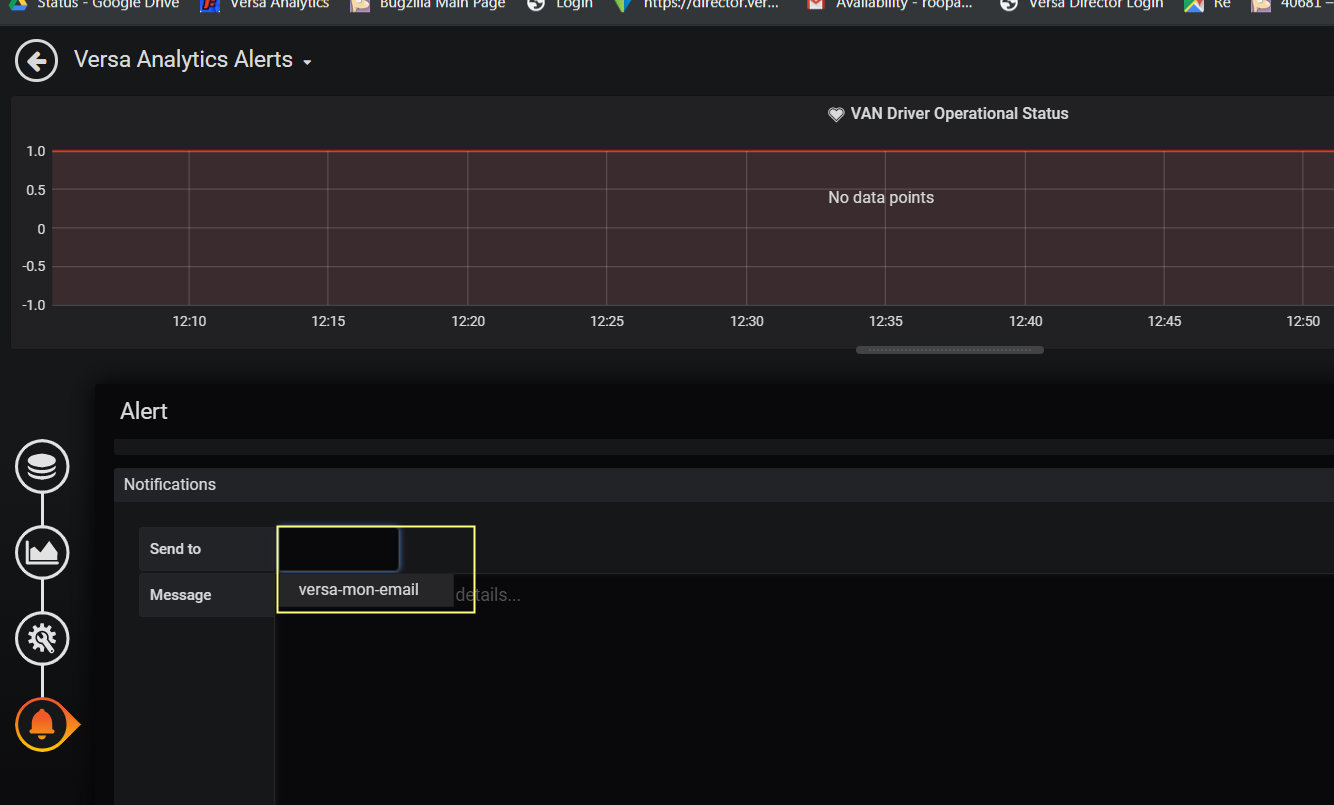
To associate a notification channel with any report, edit the report and click Alert > Notifications.
Supported Software Information
Releases 20.2 and later support all content described in this article.
