Configure Automatic Bandwidth Monitoring
![]() For supported software information, click here.
For supported software information, click here.
You can monitor a path's bandwidth automatically for SD-WAN and DIA deployments. You can then use the monitored bandwidth to perform traffic steering.
This article describes how to configure automatic SD-WAN bandwidth monitoring and automatic DIA bandwidth monitoring. Note that you cannot enable both DIA and SD-WAN bandwidth monitoring on the same interface.
Configure Automatic SD-WAN Bandwidth Monitoring
In an SD-WAN deployment, when you use data-driven SLA monitoring, you can monitor a path's bandwidth usage automatically. Typically, you use automatic bandwidth monitoring in a hub-and-spoke topology. For more information on data-driven SLA monitoring, see Configure Data-Driven SLA Monitoring.
To configure automatic SD-WAN bandwidth monitoring, you do the following:
- Configure a Versa speed-test server and assign it to a group.
- On the VOS devices, create an SD-WAN path policy, enable bandwidth monitoring, and associate the path policy with an interface.
When you enable bandwidth monitoring, you can also enable microtesting to initiate bandwidth testing more frequently. When initiating microtesting, the system does not run speed tests (upload/download tests) in active mode. Only a few TCP handshake packets are exchanged between the branch and hub nodes to share the live traffic bytes (Rx/Tx) on that particular access circuit.
Note that for bandwidth monitoring to work, port 5201 must be open on any firewall in the monitoring path. For more information, see VOS Device Firewall Requirements.
Configure Automatic SD-WAN Bandwidth Monitoring Using Versa Director
- Configure a Versa speed-test server. Typically, in a hub-and-spoke topology, you configure the hub as the speed-test server. For more information, see Configure a Versa Speed-Test Server.
- In Director view:
- Select the Configuration tab in the top menu bar.
- Select Templates > Device Templates in the horizontal menu bar.
- Select an organization in the left navigation bar.
- Select a post-staging template in the main pane. The view changes to Appliance view.
- Select the Configuration tab in the top menu bar.
- Select Services > SD-WAN > Site in the left menu bar. The main pane displays the Site pane.

- In the Site pane, click the
 Edit icon. The Edit Site popup window displays.
 - In the Group Membership field, click the
 Add icon, and then enter a name for the group to which to assign the Versa speed test servers. You configure group membership only on the device that is acting as the speed-test server. Note that if a spoke is using two hubs to perform automatic SD-WAN bandwidth measures, you must select a hub-specific group membership name.

- Click OK.
On the spoke device, configure the SD-WAN path policy to apply to branches, hubs, and Controller devices:
- In Director view:
- Select the Configuration tab in the top menu bar.
- Select Templates > Device Templates in the horizontal menu bar.
- Select an organization in the left navigation bar.
- Select a post-staging template in the main pane. The view changes to Appliance view.
- Select the Configuration tab in the top menu bar.
- Select Services > SD-WAN > Path Policies. The main pane displays the path policies that are currently configured.

- Click the Add icon. The Add Path Policy popup window displays.

- In the Policy Name field, enter a name for the policy.
- Click the Add icon. The Add Terms window displays.
- Select the Match tab, and then enter information for the following fields.
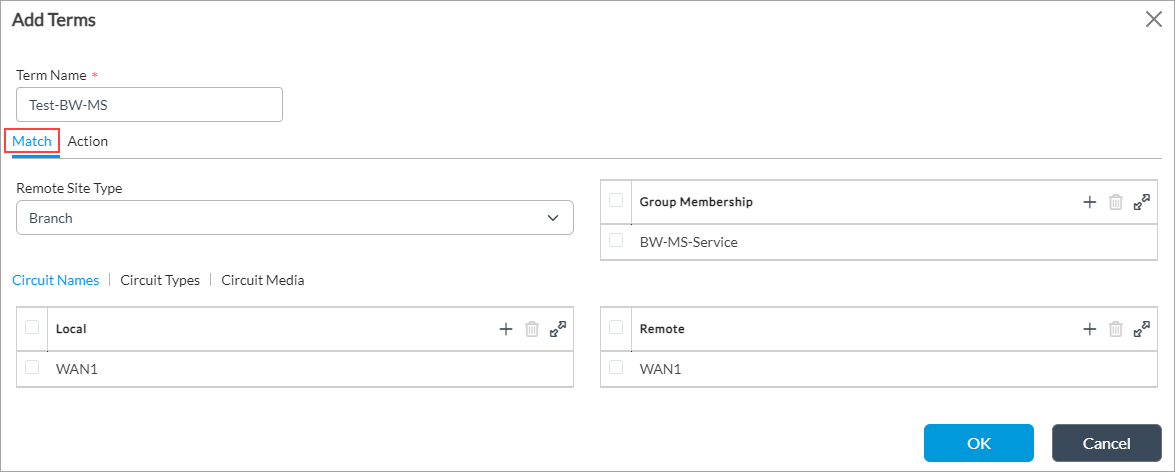
Field Description Term Name (Required) Enter a name for the term. Remote Site Type Select a remote site type with which to conduct the speed test. Group Membership Click the Add icon and select the remote node group.Circuit Names (Tab) Configure the WAN circuits to match, by circuit name. - Local
Click the Add icon. From the drop-down, select a WAN circuit name on the local branch. Circuits typically have names such as WAN1 and WAN2.- Remote
Click the Add icon. From the drop-down, select a WAN circuit name on the remote branch. - Select the Action tab, and then enter information for the following fields.
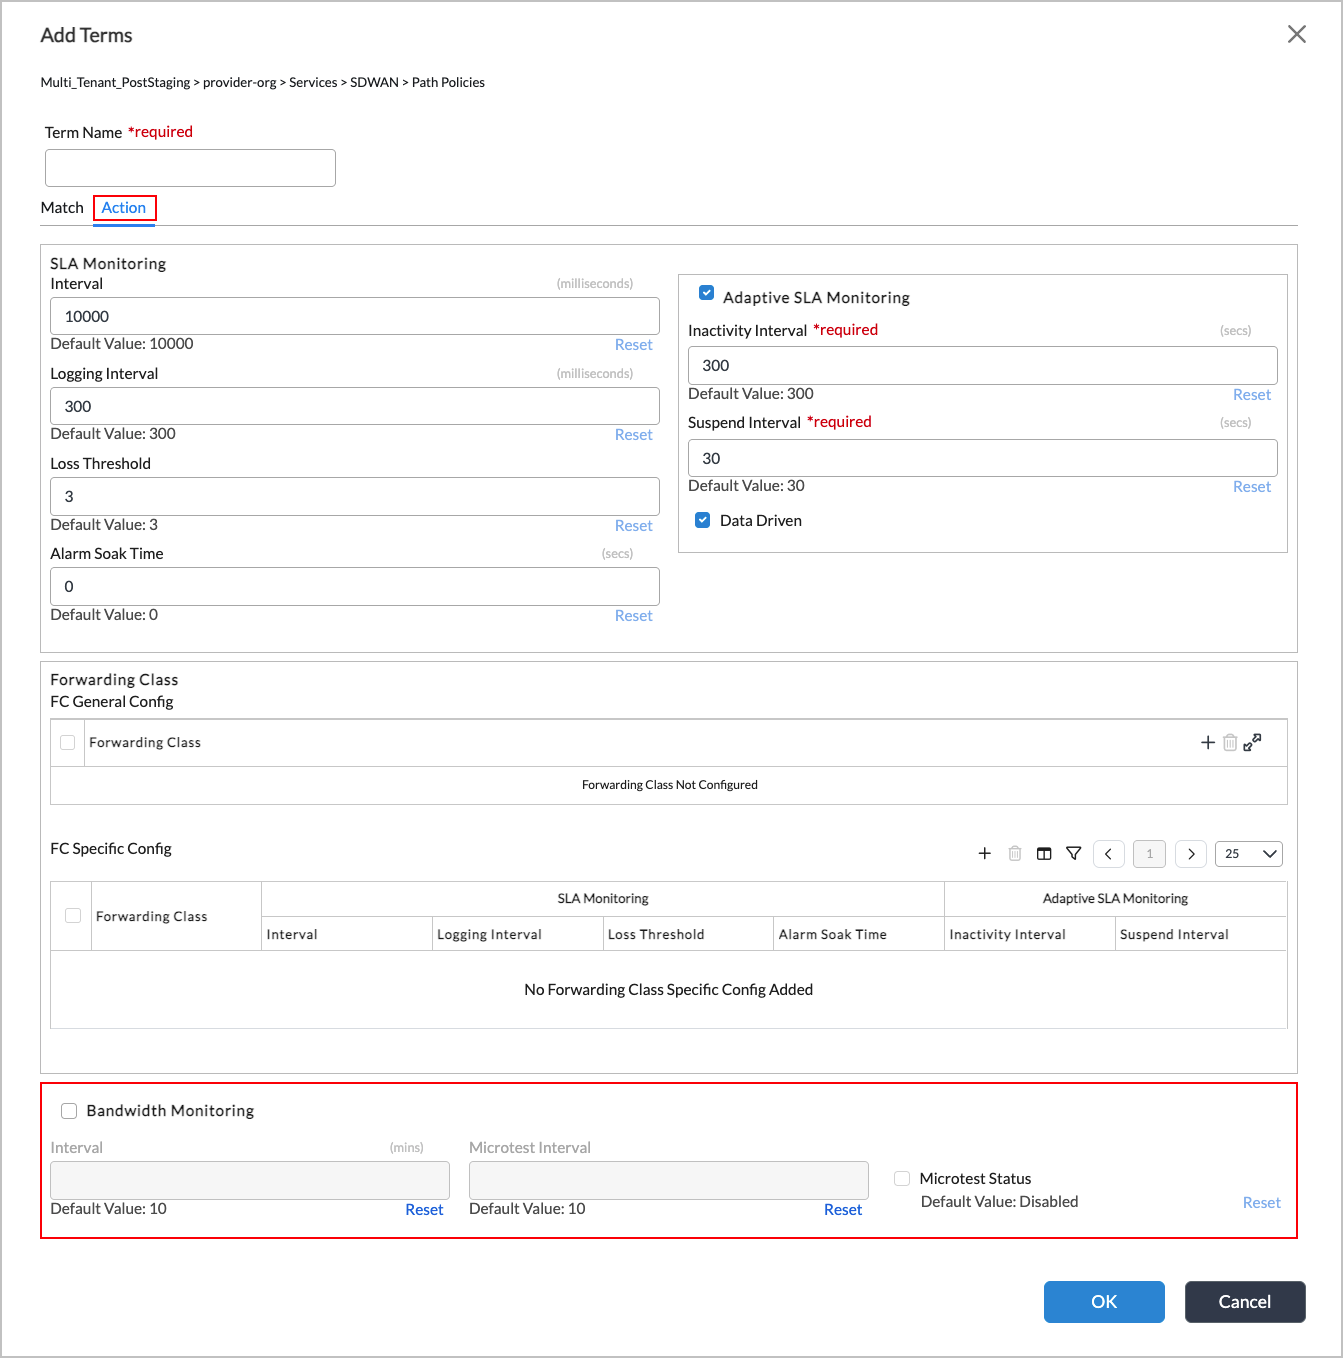
Field Description Bandwidth Monitoring Click to monitor the link bandwidth on a circuit. You can view the circuit bandwidth in the Monitor > Summary screen. Interval
Enter how often to monitor the link bandwidth, in minutes.
Range: 10 through 300 minutes
Default: 10 minutes
- Microtest Interval
(Releases 23.1.1 and later.) Enter how often to monitor the link bandwidth using microtesting, in seconds.
Range: 2 through 3600 seconds
Default: 10 seconds
- Microtest Status
Click to enable microtesting, which is disabled by default. - Click OK.
Associate the path policy with an interface:
- In Director view:
- Select the Configuration tab in the top menu bar.
- Select Templates > Device Templates in the horizontal menu bar.
- Select an organization in the left navigation bar.
- Select a post-staging template in the main pane. The view changes to Appliance view.
- Select the Configuration tab in the top menu bar.
- Select Services > SD-WAN > System > Site in the left menu bar. The main pane displays the Site pane.

- In the Site pane, click the Edit icon. The Edit Site popup window displays.

- In the WAN Interfaces table, select an interface. The Edit WAN Interfaces popup window displays.
- In the Bandwidth Monitoring Policy field, select the policy to associate with the WAN interface.

- Click OK.
Configure Automatic SD-WAN Bandwidth Monitoring Using a REST API Call
Use this API call to enable automatic SD-WAN based bandwidth monitoring.
| Versa REST API | Type |
|---|---|
| https://ip-address:9182/versa/ncs-services/api/config/devices/device/device/config/orgs/org/org-name/sd-wan/site | PUT |
The following example shows the payload of this API call:
{
   "path-policy":[
      {
         "policy-name":"BW-MS-WAN1",
         "terms":{
            "term":[
               {
                  "term-name":"Test-BW-MS",
                  "match":{
                     "remote-site-type":"branch"
                  },
                  "action":{
                     "sla-monitoring":{
                        "interval":"10000",
                        "logging-interval":"300",
                        "loss-threshold":"3"
                     },
                     "bandwidth-monitoring":{
                        "interval":"10"
                     }
                  }
               }
            ]
         }
      }
   ]
}
Use this API call to associate the path policy to an interface.
| Versa REST API | Type |
|---|---|
| https://ip-address:9182/versa/ncs-services/api/config/devices/device/device/config/orgs/org/org-name/sd-wan/site/ | PUT |
The following example shows the payload of this API call:
"wan-interfaces":{
         "vni":[
            {
               "name":"vni-0/0.0",
               "sla-monitoring-policy":"SLAM_Policy_vni-0/0.0",
               "bandwidth-monitoring-policy":"BW-MS-WAN1",
               "shaping-rate":{

               },
               "management-traffic":{
                  "priority":"0"
               }
            },
            {
               "name":"vni-0/1.0",
               "sla-monitoring-policy":"SLAM_Policy_vni-0/1.0",
               "shaping-rate":{

               }
            }
         ]
      }
Configure Automatic DIA Bandwidth Monitoring
For Releases 21.2.1 and later.
You can configure VOS devices to send DIA bandwidth monitors at a configured interval toward a peer node or a configured node with a public IP address. To do this, you configure one or more monitors on the VOS device, specifying the IP address of a remote destination. The VOS device then runs the speed test between the local and remote devices. You can then use the monitored bandwidth to perform traffic steering. For more information, see Configure SD-WAN Traffic Steering.
Note: If the destination IP address is a remote SD-WAN branch's WAN IP address, the remote branch must be configured as a speed-test server.
VOS devices can also use predeployed speed-test servers to run speed tests from Versa Director nodes. For more information, see Run Internet Speed Tests.
To configure DIA bandwidth monitors:
- Configure a Versa speed-test server. For more information, see Configure a Versa Speed Test Server.
- In Director view:
- Select the Configuration tab in the top menu bar.
- Select Templates > Device Templates in the horizontal menu bar.
- Select an organization in the left menu bar.
- Select a post-staging template in the main pane. The view changes to Appliance view.
- Select the Configuration tab in the top menu bar.
- Select Others > System > Speed Test in the left menu bar. The Speed Test screen displays.
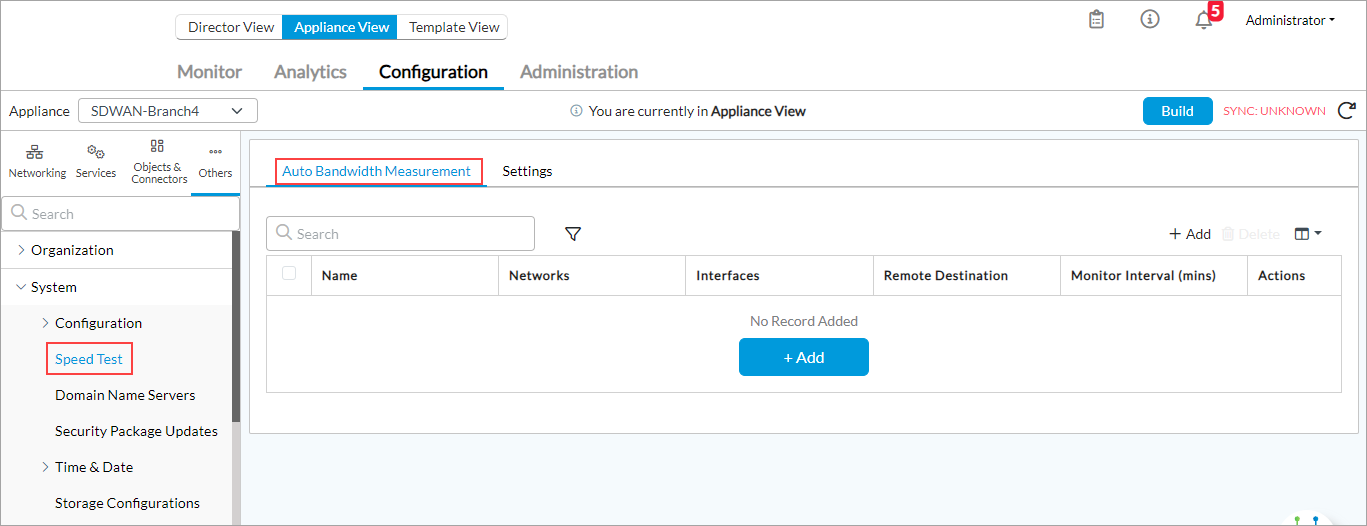
- Select the Auto Bandwidth Measurement tab.
- Click the Add icon. In the Add Bandwidth Measurement popup window, enter information for the following fields.
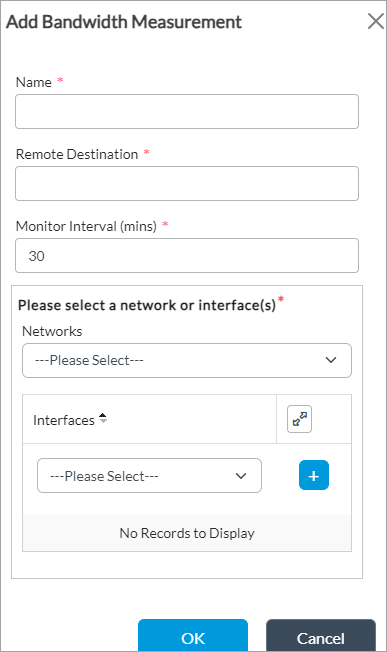
Field Description Name (Required) Enter a name for the bandwidth monitor. Remote Destination (Required) Enter the IP address of the remote node. Note that you cannot enter an FQDN as the remote destination. Monitor Interval (Required) Enter the interval between speed tests, in minutes.
Default: 30 minutes
Range: 5 to 300 minutes
Network or Interfaces (Group of Fields) Select either a network or interfaces to use for the speed test. You cannot select both. - Networks
Select a network to use for the speed test. - Interface List
Click the  Add icon and select up to 8 VNI or TVI interfaces per monitor from which to run the speed test.
 - Click OK.
To define next-hop parameters and priorities for DIA traffic, you configure them in a Layer 3 SD-WAN traffic forwarding profile, on the Next Hop tab in the Add (or Edit) Forwarding Profile popup window. For more information, see Configure SD-WAN Traffic Steering.
View the Monitored Bandwidth
For Releases 21.2.1 and later.
To view the SD-WAN or DIA monitored bandwidth:
- In Director view:
- Select the Administration tab from the top menu bar.
- Select Appliances in the left menu bar.
- Select the device in the main pane. The view changes to Appliance view.
- Select the Monitor tab in the top menu bar.
- Select an organization in the left menu bar.
- Select the Summary tab in the horizontal menu bar.
- For the interface that you used for the speed test, click the
 Eye icon in the Bandwidth column. The Bandwidth Results popup window displays.

- Select the Path Bandwidth Measurement (SD-WAN) tab or the Bandwidth Measurement (DIA) tab to display the results for each type of measurement.

To check the calculated bandwidth from the CLI, issue the following command:
admin@SD-WAN-Branch3-New-cli> show system bw-measurement monitor status brief
           BANDWIDTH
INTERFACE  MONITOR                                            REMOTE      DOWNLINK    UPLINK     LAST
NAME       NAME       SOURCE ADDRESS  REMOTE ADDRESS  FQDN    BANDWIDTH   BANDWIDTH   TRIGGERED  STATUS
-----------------------------------------------------------------------------------------------------------------------------
vni-0/0.0  wan1_mon   192.168.200.10  192.168.200.40  N/A     95.99 Mbps  93.44 Mbps  00:01:00   completed-within-threshold
vni-0/1.0  wan2_mon   192.168.200.11  192.168.200.41  N/A     95.77 Mbps  95.05 Mbps  00:01:00   completed-within-threshold
Supported Software Information
Releases 20.2.1 and later support all content described in this article, except:
- Release 21.2.1 adds support for speed tests over DIA links and viewing the monitored bandwidth.
- Release 23.1.1 adds support for the Microtest Interval and Microtest Status bandwidth-monitoring options when configuring an SD-WAN path policy.